Wnat’s your interpretation? — March 1999
What’s your interpretation? |

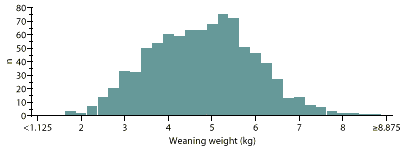
This figure is a histogram showing how many of 888 pigs from a 700-sow herd fell into each weaning weight category. How would you statistically analyze these data?
Choosing the correct statistical test
 This month’s "What’s your interpretation"
is the first of a series that will explain how to select the appropriate
statistical tests for various types of data.
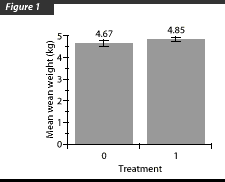
The figure on the front represents the weaning weights for the pigs in the treatment and control groups from a trial in which:
- "treatment" pigs (n=582) received an injection of levamisole, and
- "control" pigs (n=306) did not receive the injection.
For the purposes of this explanation, we will assume that:
- the pigs represent the population from which they were selected, and
- the treatment pigs are the same as the control pigs in every way except that they received the treatment.
Statistics can tell us whether the average weaning weight of the controls is "significantly" different than the average of the treated pigs–i.e., whether the difference we observe is due to the treatment or due merely to chance.
Outcome variables
For any type of statistical test, the first step is to identify the outcome (or "dependent") variable. Simply put, the outcome variable is the variable of interest. The easiest way to determine which variable is your outcome variable is to ask, "what are we measuring?" In the case of our study above, we measured the weaning weights of the pigs, so weaning weight is our outcome variable.
Outcome variables fall into one of three categories. Because the different variable types have different mathematical properties, correctly determining what type of variable we are working with is a key factor in deciding which statistical test is appropriate. The three types of outcome variables include:
- binary: a variable that can take only one of two possible values (yes/no). For example, if we are trying to determine the effect of a certain treatment on farrowing (our outcome variable), we measure whether she farrowed (yes) or didn’t (no).
- ordinal: a variable that measures a set of qualitatively ordered categories. For example, if we are assessing the effect of a certain treatment on the severity of clinical signs, we might set up a "clinical severity scale" where 0 = normal, 1 = mild, 2 = moderate, and 3 = severe clinical signs. These are essentially qualitative assessments, because it is impossible to say how much more (in a mathematical sense) a rating of "2" is than a rating of "1." Instead, we would speak in qualitative terms of "better" or "worse."
- continuous: a variable that can take on any value (within biological limits), and that can be measured to the greatest precision permitted by the measuring instrument. Weaning weights are such a variable: they can range from the lightest possible weight a pig could be at weaning (the biological limit) to the heaviest possible biological limit. Weight can be measured to the greatest number of decimal places the scale will allow. Furthermore, we can define exactly the difference between two weights; 3 kg is 1 kg more than 2 kg, and the difference between 3 kg and 2 kg is the same as the difference between 6 kg and 5 kg.
Obviously, these three types of variables all have specific, discrete mathematical properties and expected distributions. Statistical tests are based on these expected distributions. Therefore, you must correctly indentify the variable type of your outcome variable.
In our next issue, we will discuss another crucial decision node in determining the appropriate statistical test for a set of data: whether or not those data are normally distributed.
References
Kumar S, Dewey CE, Friendship RM, Shewen P. Improved daily gain and disease resistance using levamisole as an immunomodulator. Proc AASP Ann Meet. 1998:379-385.
Snedecor GW, Cochran WG. Statistical Methods. Iowa State University Press. Ames, Iowa. 7th Edition. 1980.
This page last updated .