What’s your interpretation? — November/December 1997
What’s your interpretation? |
 This histogram shows the distribution of age at
first farrowing (days) of 2272 breeding females. All animals entered the
same breeding herd during the period November 1992-February 1996. While
the mean age at entry for breeding females that subsequently farrowed was
182 days (range: 151-252 days), their mean age at farrowing was 360 days
(range: 310-595 days).
Does age at first farrowing influence liveborn litter size? Piglet birth weights? Lifetime productivity? What important step should you carry out before proceeding to analyze performance by breeding female age?
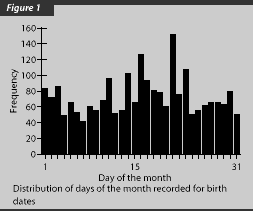
Before proceeding with any analysis involving breeding female age, it is essential to validate birth dates. One way to build confidence that birth dates are accurately recorded is to look at the distribution of days of the month contained in birth dates (Figure 1). As the probability of being born on any day between the 1st and 30th of any month is roughly equal, we would expect to see a uniform distribution,with a shorter column for the 31st. If only a few days are represented (typically 1st, 15th, and 30th), then recorded birth dates are not accurate and any age-wise analysis is likely to be flawed (SHAP 2(1):39. 1994).

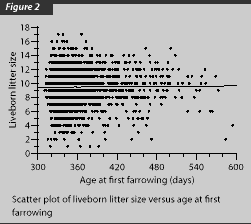
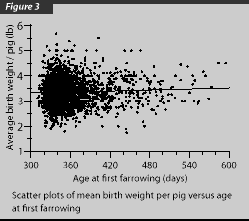
Scatter plots of liveborn litter size (Figure 2) and mean birthweight per pig (Figure 3) versus age at first farrowing suggest that both measures are independent of age at first farrowing in this herd.


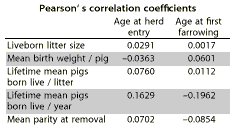
Further evidence of the weakness of these relationships is provided by Pearson’s correlation coefficients, which express the strength of linear relationships between pairs of variables. Values of correlation coefficients range between +1, representing a complete positive association, to -1, representing a complete negative association. Values of correlation coefficients for selected first-parity and lifetime productivity measures are shown in the table below:

As all values in the table fall within the range of -0.2 to +0.2, we may conclude that first-parity and lifetime performance of breeding females in this particular production system are independent of both age at herd entry and age at first farrowing.
Editors’ note:
It is with sincere regret that we announce that this is the final issue in which ‘What’s Your Interpretation?’ will be authored by Dr. Will Marsh. Will has faithfully provided the ‘What’s your interpretation?’ column since the first issue of Swine Health and Production was published in January 1993. Altogether, he has authored 30 insightful and educational columns. Thanks, Will, for your service to the AASP and Swine Health and Production–we genuinely appreciate your contribution!
We are pleased to announce that beginning with the January 1998 issue, ‘What’s your interpretation?’ will be written by Dr. Jinliang Xue of the University of Minnesota. We look forward to working with him!