Clinical trials (experimental designs in realistic-use settings) provide the highest level of evidence for the efficacy of interventions.1 However, there is evidence from the published research that trial design, conduct, and analysis is suboptimal in swine trials.2-4 Previous commentaries in this series have discussed accessibility of research reports,5 issues relating to selection of interventions and outcomes,6,7 and reducing risk of bias8 to maximize the value of swine trial research. In this commentary, we focus on the issue of clustering.
Clustering is an important consideration in swine research because animals are housed in pens, multiple pens may be present within a room, and there may be multiple rooms within a barn. This grouping of animals has implications when designing and analyzing a trial. First, the researcher needs to determine the unit of concern (ie, the unit at which allocation to intervention groups will be conducted). Second, although there will be individual variability in outcomes between animals housed together, animals within a group may be more similar than animals in different groups. This may be related to the location of a pen within a barn, to the sharing of air space, feed troughs, and water sources among animals when the outcome of interest is infectious, or may relate to differences in the social dynamic between individual animals in a group. An evaluation of grower-finisher mortalities and culling rates found that nearly 70% of the rate variation could be explained by the barn-to-barn variation.9 This similarity of pigs within groups results in subpopulations, or clusters of pigs, whose performance, health, and other outcomes are not truly independent of each other, which leads to statistical nonindependence of pigs within those groups. This nonindependence violates assumptions used in sample size calculations and statistical analyses.10,11 However, the potential for clustering often is overlooked in swine trials; clustering was not accounted for in any of the 135 trials included in a meta-analysis on the efficacy of bacterial respiratory vaccines in swine.3 This is important because control of clustering leads to smaller standard errors which would impact the confidence in the effect size and the weight given to an estimate in meta-analysis. Further, the smaller P value would increase the type 1 error risk (increase false-positive results) if null hypothesis testing is used for inference (ie, whether the intervention is beneficial, harmful, or not significantly associated with the outcome). In an evaluation of 67 epidemiological studies in animal populations, it was estimated that the inference based on null hypothesis testing would have changed in 46% of the articles if the authors had adjusted for clustering.12
The objective of this commentary is to describe issues related to clustering in swine trials using illustrative examples. The technical sections of this commentary (sample size calculations and statistical analyses) are structured such that the first paragraph describes the important take-home messages for individuals who read, interpret, and use the results of trials conducted in clustered populations. The remainder of each section provides more technical details for individuals who conduct trials in clustered populations.
Setting the stage – how was the intervention given and the outcome measured?
When designing a trial, the researcher needs to consider both the unit of concern and the unit of observation, which may not be the same. The unit of concern (also referred to as the unit of allocation, the unit of randomization, or the experimental unit) refers to the organizational level (eg, animal, pen, or room) at which an intervention is applied.13 The appropriate unit of concern will depend on the research question, how the intervention is intended to be used in a realistic-use setting, and the nature of the outcome. For instance, if the intervention is a treatment that would be applied to an individual sick pig, then the individual animal would be an appropriate unit of concern (experimental unit). However, if the intervention normally would be provided to a pen, then pen would be the appropriate unit of concern. Examples of interventions applied at a pen-level might include antibiotics administered in the feed or water, diet or dietary formulations, or provision of objects to enrich the environment. If the outcome is infectious by the airborne route, then the appropriate unit of concern may be the room or barn rather than the pen.
The unit of observation is the organizational level at which the outcome is measured, and may correspond to a body part (eg, a limb if the outcome on one limb within a pig is compared to the outcome on another limb of the same pig), an animal, a litter, a pen, a room, or a barn. The unit of observation will depend on the outcome and may vary by outcome within a trial. For example, in a trial to assess the efficacy of batch medications for intestinal infections in nursery pigs, the unit of concern was the pen. The unit of observation varied between 2 included outcomes; the outcome of weight gain was measured at the individual pig level and the outcome of pathogenic bacterial load as determined from pooled fecal floor samples was measured at the pen level.14
Why does it matter? Knowing when clustering is an issue
When evaluating the efficacy of interventions, clustering of animals associated with a pen (or other organizational level which defines the cluster such as a room or barn) can be of concern when it results in nonindependence of animals. To illustrate the concept further, consider the following simple hypothetical (but realistic) trial designs:
Design variation I – no clustering
Figure 1 represents a scenario such as a treatment trial, where only some pigs in the pen are eligible for the study (in the figure, gray pigs are not eligible, whereas black and white pigs represent 2 intervention groups). As an example, consider a trial to compare the efficacy of 2 antibiotics (represented by the white pigs and black pigs) for the treatment of respiratory disease in individual pigs. In this scenario, when a pig develops respiratory disease and requires treatment, the pig is randomly assigned to receive 1 of 2 interventions. Importantly this is a single pen design. Therefore, there may be pigs within the pen who do not develop respiratory disease (represented by the gray pig) and therefore are not treated, or pigs within the pen treated with either of the 2 antibiotics. The pigs in this pen might be more similar to each other than to pigs in other pens in the same barn. However, because there is only 1 pen included in the trial, and both interventions are given within that same pen, the pigs would be considered statistically independent, and clustering is not a concern. In this scenario, given the single pen design, a simple chi-square test can be conducted to evaluate whether the intervention group was associated with clinical cure (binary outcome, yes/no, cured/not cured) or a t test could be used to evaluate whether the intervention group was associated with daily gain (continuous outcome).

Design variation II – clustering
Now consider a variation to the trial design as depicted in Figure 2. In this scenario, individual pigs are still randomly allocated to intervention group within pen, but there are multiple pens. If the number of animals allocated to receive an intervention within a pen was not large, then the number within each intervention group may vary between pens. Using the same example of comparing 2 antibiotics for treating respiratory disease in individual pigs, imagine that there were multiple pens of pigs eligible for inclusion in the trial. There may be pens with no sick pigs, pens with all sick pigs only treated with one antibiotic, pens with all sick pigs treated with the other antibiotic, and pens where some sick pigs were treated with the first antibiotic and some were treated with the second antibiotic. In this case, the treatment may be associated with pen-level effects, such as pen area within the barn, level of disease exposure within a pen, difference in ventilation or access to feed or water resources, or differences in many other factors which lead to clustering. Even a small amount of clustering can have a substantial impact on the standard errors (and therefore confidence intervals and P values) of an intervention effect.13 Therefore, more advanced statistical analyses which include control for the effect of clustering factors, such as pen, would be needed.
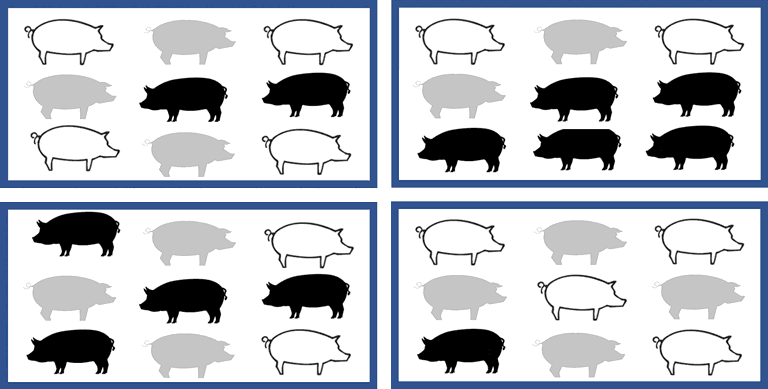
Figure 3 illustrates a scenario where not all pigs within a pen are eligible for inclusion in a trial (for example, only clinically ill pigs receive an intervention), but where individual pigs within a group receive the same intervention (ie, random allocation to intervention groups at the pen level). While this might not be a common scenario when a pen defines the group, it might occur when the group represents a room or a barn. If there was only 1 group per intervention (as shown in the figure), then “intervention” would be completely confounded by “group”, and no meaningful analyses could be undertaken without the assumption that the groups are exactly the same. This situation is referred to as pseudoreplication. An example of this might be a trial comparing 2 antibiotics given to individual pigs with respiratory disease where there were 2 rooms within a barn included in the trial and all treatment pigs within a room were given the same antibiotic. If, however, there were more than 2 rooms included in the trial (and therefore more than 1 room receiving each of the antibiotic treatments), then clustering at the room level would need to be considered during sample size calculations and analysis.

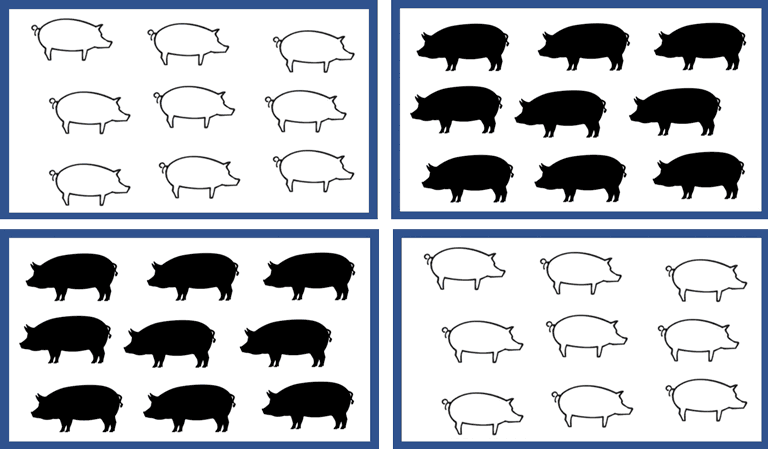
Design variation III – cluster-randomized trial
Figure 4 illustrates a scenario where interventions are allocated at the group level with all pigs within a group receiving the same intervention. This design is referred to as a cluster-randomized trial and likely is the most common design for swine trials because many interventions are given to all animals within a group (eg, at the pen level), at least under commercial conditions. In this scenario, the group might represent a pen, room, barn, or a site. Common examples of this scenario would be vaccine trials, feed trials, or trials where an intervention is administered in the feed or water. Consider, therefore, an example of a trial comparing animal health (eg, incidence of respiratory disease) between 2 vaccines. In this example, assume that all animals within a pen receive the same vaccine. Therefore, each pen is randomly assigned to vaccine 1 or vaccine 2. The outcome related to respiratory disease could be measured at either the individual level (presence/absence of respiratory disease during the trial period for each pig) or at the room level (percentage of pigs within each room who experienced respiratory disease during the trial period). If the outcome was measured at the animal level, then nonindependence would be present and clustering due to room would need to be considered in the analysis. If the outcome was measured at the room level as the percentage of pigs with respiratory disease, then there is no need to control for clustering due to room. However, the sample size would be determined by the number of rooms rather than the number of animals in the trial, and therefore a larger number of rooms would need to be enrolled in the trial.
These figures and examples illustrate clustering based on 1 organizational level (eg, at the pen level). However, it is common for swine data to be clustered at several levels. For instance, pigs within pens, pens within barns, and barns within sites. It also should be noted that clustering is not always related to housing. When outcomes are measured on the same animal at multiple time points (ie, repeated measures design), there is nonindependence over time as each pig’s measurement over time is not independent of its previous measurement. In this commentary, we focus on clustering due to grouping of animals, but the same concepts apply to repeated outcome measures over time.
Take a deep breath and sample size on – sample size considerations for randomized controlled trials
The presence of nonindependence needs to be considered when calculating a sample size for a randomized controlled trial, or the number of animals, pens, or barns included in a trial may not be sufficient to determine whether an intervention is effective. When a trial is designed, the difference (delta) between the groups that the researcher wishes to detect with a specified power (1-beta) is prespecified. Further, an acceptable level of type 1 error (alpha or false positives) is specified. Consider a scenario where the intervention is allocated to pens, the outcome is measured in individual pigs, and the statistical analysis is conducted appropriately to account for clustering. If the sample size was calculated for individual animals without considering the effect of pen, then the sample size will be too small (have less power) to find differences between intervention groups. Alternatively, if the statistical analysis does not appropriately control for the nonindependence caused by clustering, then the probability of a type I error (false positive) is increased, meaning that the trial results may suggest that the treatment is effective when it is not. For readers who need to calculate sample sizes for trials where clustering may be present, the following sections provide more technical details.
The reason that clustering needs to be considered when calculating sample size is because when pigs are aggregated into a group, such as a pen, there are 2 sources of variation in the outcome of interest, variation from the effect of the pig and variation from the effect of the pen. For this reason, the “effective sample size” for statistical analyses is less than the actual number of pigs.10 The independent population sample size will also differ based on whether the trial is intended to evaluate superiority, equivalence, or noninferiority of interventions.10,15 When nonindependence is not of concern, online sample size calculators are available for superiority trials (for example, see http://www.openepi.com/SampleSize/SSCohort.htm). When nonindependence due to clustering is present, sample size calculations are more complex. A complete discussion of sample size calculations for clustered populations is beyond the scope of this commentary. However, sample size calculations for clustered data require specification of the cluster variation in addition to all the parameters used in the independent population sample size calculation (power, type I error rate, the expected proportion with the event in both groups [with the difference between groups corresponding to the difference the investigator wishes to detect as significant] or, for continuous outcomes, the expected mean in both groups or the expected mean difference, and the standard deviation of the mean or mean difference).10
One approach to calculating sample sizes for cluster-randomized trials is to calculate a sample size based on independent units of concern and multiply that number by a “design effect.”16 The design effect is a function of the number of animals per cluster and the intraclass correlation coefficient (ICC), which is a measure of the similarity of individuals within a cluster.10,16,17 The design effect can be calculated as 1+(n-1)*p, where n is the number of animals per pen (or other unit of allocation such as room or barn) and p is the ICC. An ICC of zero would indicate independence of individuals within the cluster, whereas an ICC of 1 (or 100%) would mean that measurements for all individuals in the cluster would give the same result.
Although conceptually simple, sample size calculations adjusted for clustering using the design effect assume the ICC for an outcome is known, which often is not the case. Some ICC estimates for swine populations are available. Weber et al14 estimated ICC values of 12.3%, 4.2%, and 22.6% for average daily gain (ADG) from 14 to 35 days post weaning at the herd, batch, and pen level, respectively. Intraclass correlation coefficients for seroconversion between batches within a farm was estimated at 10% for Actinobacillus pleuropneumoniae and 50% for Mycoplasma hyopneumoniae.18 Intraclass correlation coefficients have been calculated for a number of other infectious diseases in livestock from observational studies published in the literature; these values range from 0.17% for lamb mortality to 46% for Brucella serotitres in cattle12 and from 4% for Anaplasmosis in cattle to 42% for bovine viral diarrhea.19 In the absence of swine-specific estimates of ICC, a comparison to diseases with similar infectivity might be helpful. However, sample size calculations for clustered populations can be complex and therefore individuals planning a trial where clustering may be an issue should include an epidemiologist or statistician with expertise in sample size calculations for clustered data on the research team.
To illustrate the differences between sample size calculations, the following example calculates a sample size for a superiority trial with no adjustment for clustering, a superiority trial with a low estimated ICC of 4%, and a superiority trial with a high estimated ICC of 50%. For this example, we assume that pigs are housed in pens of 25 animals each and we set the power at 80% and type I error rate at 5%. We use a binary outcome and assume that the outcome incidence is 30% in the baseline group and that a 10% increase in the proportion with the outcome would justify the use of the intervention of interest. Under these scenarios, the required sample size per intervention group would be 353 pigs/group with no adjustment for clustering (which would correspond to approximately 14 pens/group), 692 pigs/group (28 pens/group) with a 4% ICC, and 4589 pigs/group (183 pens/group) with a 50% ICC. If the intervention was allocated at the pen level, and there was a single outcome measure per pen (ie, the outcome was measured as the percentage of pigs experiencing the outcome), then the sample size calculation would need to be at the pen level. Expanding on the previous example, if the mean anticipated percentage positive in the baseline group was 30%, and an increase in the mean percentage positive of 10% would justify the use of the intervention, an estimate of the expected variability in these percentages also would be needed. However, the required sample size would be larger than the 14 pens/group that was calculated for the previous scenario. The design effect is not only impacted by the ICC, but also by the number of pigs within each pen (or other grouping variable). To illustrate using the same example, but assuming that the unit of allocation is a room of 250 pigs (rather than a pen of 25 pigs), the required sample size with a 4% ICC would be 3869 pigs/group (corresponding to approximately 15 rooms/intervention group).
The final frontier – clustering and statistical analysis
When analyzing data where clustering is present, it is important to control for the resulting statistical nonindependence in the analysis. When the outcome is measured at the individual level, and individual animals are grouped within pens, failure to account for clustering leads to spuriously small P values and over-narrow confidence intervals. This increases the chance of a false-positive finding (ie, finding that the intervention is effective when it is not).20,21 Therefore, when reading a trial report, individuals should consider whether clustering is likely to be present and, if so, look to see whether the authors described controlling for clustering (eg, by controlling for the pen effect). If not, the resulting P values and confidence in the effect estimate should be viewed with skepticism. The remainder of this section deals with the more technical aspects of controlling for clustering in statistical analysis and may be more relevant to individuals conducting trials in clustered populations. A complete discussion of analytical solutions is beyond the scope of this commentary. However, relevant references are provided for the interested reader. Researchers may wish to consult these resources for additional information or may wish to include an epidemiologist or statistician with expertise in trial design and statistical analysis of clustered data on the research team.
One approach to controlling for clustering is to conduct the analysis at the level of the unit of allocation.21 This might involve an outcome measured directly at the level of allocation or could involve aggregating individual animal data to the cluster unit level. An example might be ADG as an outcome. If the researcher allocated pens to 1 of 2 intervention groups, with all animals within a pen receiving the same intervention, then the effect of clustering by pen would need to be considered. The researchers could control for that clustering by conducting the analysis at the pen level, ie, having 1 observation corresponding to the mean ADG for each pen. However, if the analysis is conducted at the level of the unit of allocation, it means that the sample size corresponds to the number of pens, entailing a dramatic reduction in sample size and therefore, a reduction in statistical power.21
A conceptually simple method to control for clustering in the analysis of trial data is to adjust the test statistic based on the design effect. Test statistics based on chi-square (eg, comparing proportions) would be divided by the design effect and test statistics based on the t test (eg, comparing means) would be divided by the square root of the design effect.20 However, this approach is an approximation and is only relevant for cluster-randomized trials. Additionally, this approach assumes that the ICC is known or can be calculated with the available data, that the ICC is constant across the pens, and that the number of animals per pen is the same.13 Therefore, it is not the best of the available approaches.
Another simple approach is to include pen (or other grouping variable) as a fixed effect in a regression model when estimating treatment effects.22 While this approach is possible, it means that each pen included in the analysis will correspond to a degree of freedom in the statistical calculations, reducing statistical power compared to the methods described below. More importantly, the inference from an analysis which includes fixed effects for the grouping variable (eg, pen) also differs; inferences on the intervention effects are specific to each pen rather than to a more general population of pens of pigs.13 Researchers conducting trials would not be interested in inferences for a specific pen. Therefore, using a fixed effects approach for pen is a problematic approach to controlling for clustering.
Finally, mixed model regression techniques and generalized estimating equations can be used to control for clustering. These methods offer advantages in terms of fewer assumptions and an ability to deal with different numbers of animals within groups. It also is possible to control multiple organizational levels, such as pen, barn, and site, within the same analysis. These approaches are routine and readily conducted in software such as R, SAS, or Stata. More detailed descriptions of these methods for continuous and binary outcomes are available elsewhere.13,23,24 If a researcher is not familiar with these approaches or software, they should consider including an epidemiologist or statistician on the research team to assist with the analysis, as well as with calculation of an appropriate sample size.
To illustrate the potential magnitude of this issue, a simple example is provided. Consider a hypothetical trial involving 40 litters of 10 piglets each, randomly assigned to 1 of 2 interventions related to a creep feed supplement. The intervention would be allocated at the litter level, with 20 litters receiving the creep feed supplement and 20 litters receiving no treatment. The outcome is ADG at 21 days of age. Hypothetical results for this example are calculated using 1) no adjustment for clustering within litter with ADG calculated at the individual piglet level, 2) measurement of ADG at the litter level (ie, mean ADG for all 10 piglets within a litter), 3) analysis at the individual piglet level with a post hoc adjustment for clustering assuming a 4% ICC and a 1.36 design effect, and 4) analysis at the individual piglet level with a post hoc adjustment for clustering assuming a 50% ICC and a 5.5 design effect. Results are shown in Table 1. When clustering was not controlled, the intervention effect size was associated with a P = .012. In comparison to all other scenarios, that P value was inappropriately small.
| Scenario | Intervention | ADG at 21 days, g | SEM | P value |
| No control of clustering | Creep supplement | 230 | 7 | .01 |
| Placebo | 205 | 7 | ||
| Outcome measured at group level | Creep supplement | 230 | 16.1 | .298 |
| Placebo | 205 | 17.4 | ||
| Post hoc control of clustering (ICC = 4%) | Creep supplement | 230 | 7 | .03 |
| Placebo | 205 | 7 | ||
| Post hoc control of clustering (ICC = 50%) | Creep supplement | 230 | 7 | .28 |
| Placebo | 205 | 7 |
This commentary illustrates issues related to clustering in clinical trials in swine. If clustering is not accounted for when determining the sample size and when conducting the analysis, then there is an increased probability of a type I error (false-positive finding). If clustering is not accounted for when determining the sample size, but is adjusted for during the analysis, statistical power will be less than the desired level, increasing the probability of a type II error. Therefore, failure to consider clustering in the design and analysis of a clinical trial can lead to an inaccurate evidence base for decision-making about interventions. Thus, failure to adequately address clustering contributes to research wastage and needs to be improved to maximize the research investment in swine trials.
Implications
- Clustering is common in swine trials due to housing pigs in pens, rooms, barns, and sites.
- Consider clustering in sample size calculations to avoid under sampling.
- Failure to control clustering in the analysis increases the probability of a type I error.
Acknowledgments
The authors were responsible for developing the ideas presented in this commentary. Partial funding support was obtained from the University of Guelph Research Leadership Chair (Sargeant).
Conflict of interest
None reported.
Disclaimer
Drs O’Sullivan and Ramirez, this journal’s executive editor and editorial board member, respectively, were not involved in the editorial review of or decision to publish this article.
Scientific manuscripts published in the Journal of Swine Health and Production are peer reviewed. However, information on medications, feed, and management techniques may be specific to the research or commercial situation presented in the manuscript. It is the responsibility of the reader to use information responsibly and in accordance with the rules and regulations governing research or the practice of veterinary medicine in their country or region.
References
1. Sargeant JM, Kelton DF, O’Connor AM. Study designs and systematic review of interventions: Building evidence across study designs. Zoonoses Public Health. 2014;61(Suppl 1):10-17. https://doi.org/10.1111/zph.12127
2. Sargeant JM, O’Connor AM, Winder CB. Editorial: Systematic reviews reveal a need for more, better data to inform antimicrobial stewardship practices in animal agriculture. Anim Health Res Rev. 2019;20(2):103-105. https://doi.org/10.1017/S1466252319000240
3. Sargeant JM, Deb B, Bergevin MD, Churchill K, Dawkins K, Dunn J, Hu D, Moody C, O’Connor AM, O’Sullivan TL, Reist M, Wang C, Wilhelm B, Winder CB. Efficacy of bacterial vaccines to prevent respiratory disease in swine: A systematic review and network meta-analysis. Anim Health Res Rev. 2019;20(2):274-290. https://doi.org/10.1017/S1466252319000173
4. Sargeant JM, Bergevin M, Churchill K, Dawkins K, Deb B, Dunn J, Hu D, Moody C, O’Connor AM, O’Sullivan TL, Reist M, Wang C, Wilhelm B, Winder CB. A systematic review of the efficacy of antibiotics for the prevention of swine respiratory disease. Anim Health Res Rev. 2019;20(2):291-304. https://doi.org/10.1017/S1466252319000185
5. Sargeant JM, O’Connor AM, O’Sullivan TL, Ramirez A, Versluis AM. Maximizing value and minimizing waste in research in swine: Availability and accessibility of research reports. J Swine Health Prod. 2022;30(5):313-318. https://doi.org/10.54846/jshap/1291
6. Sargeant JM, O’Connor AM, O’Sullivan TL, Ramirez A. Maximizing value and minimizing waste in clinical trial research in swine: Selecting interventions to build an evidence base. J Swine Health Prod. 2022;30(6):355-361. https://doi.org/10.54846/jshap/1295
7. Sargeant JM, O’Connor AM, O’Sullivan TL, Ramirez A. Maximizing value and minimizing waste in clinical trial research in swine: Selecting outcomes to build an evidence base. J Swine Health Prod. 2023;31(1):29-35. https://doi.org/10.54846/jshap/1300
8. Sargeant JM, O’Connor AM, O’Sullivan TL, Ramirez A. Maximizing value and minimizing waste in clinical trial research in swine: Design features to minimize bias. J Swine Health Prod. 2023;31(2):82-86. https://doi.org/10.54846/jshap/1313
9. Larriestra AJ, Maes DG, Deen J, Morrison RB. Mixed models applied to the study of variation of grower-finisher mortality and culling rates of a large swine production system. Can J Vet Res. 2005;69(1):26-31.
10. Stevenson MA. Sample size estimation in veterinary epidemiologic research. Front Vet Sci. 2021;7:539573. https://doi.org/10.3389/fvets.2020.539573
11. Grawitch MJ, Munz DC. Are your data nonindependent? A practical guide to evaluating nonindependence and within-group agreement. Understanding Stat. 2004;3:231-257. https://doi.org/10.1207/s15328031us0304_2
12. McDermott JJ, Schukken YH. A review of methods used to adjust for cluster effects in explanatory epidemiological studies of animal populations. Prev Vet Med. 1994;18(3):155-173. https://doi.org/10.1016/0167-5877(94)90073-6
13. Dohoo I, Martin W, Stryhn H. Veterinary Epidemiologic Research. 2nd ed. VER Inc; 2009.
14. Weber NR, Pedersen KS, Hansen CF, Denwood M, Hjulsager CK, Nielsen JP. Batch medication of intestinal infections in nursery pigs – A randomised clinical trial on the efficacy of treatment strategy, type of antibiotic and bacterial load on average daily weight gain. Prev Vet Med. 2017;137(Pt A):69-76. https://doi.org/10.1016/j.prevetmed.2016.12.018
15. Stefanos R, Graziella D, Giovanni T. Methodological aspects of superiority, equivalence, and non-inferiority trials. Intern Emerg Med. 2020;15:1085-1091. https://doi.org/10.1007/s11739-020-02450-9
16. Donner A, Birkett N, Buck C. Randomization by cluster. Sample size requirements and analysis. Am J Epidemiol. 1981;114(6):906-914. https://doi.org/10.1093/oxfordjournals.aje.a113261
17. Rutterford C, Copas A, Eldridge S. Methods for sample size determination in cluster randomized trials. Int J Epidemiol. 2015;44(3):1051-1067. https://doi.org/10.1093/ije/dyv113
18. Vigre H, Dohoo IR, Stryhn H, Busch ME. Intra-unit correlations in seroconversion to Actinobacillus pleuropneumoniae and Mycoplasma hyopneumoniae at different levels in Danish multi-site pig production facilities. Prev Vet Med. 2004;63(1-2):9-28. https://doi.org/10.1016/j.prevetmed.2004.02.002
19. Otte MJ, Gumm ID. Intra-cluster correlation coefficients of 20 infections calculated from the results of cluster-sample surveys. Prev Vet Med. 1997;31(1-2):147-150. https://doi.org/10.1016/s0167-5877(96)01108-7
20. Campbell MK, Mollison J, Steen N, Grimshaw JM, Eccles M. Analysis of cluster randomized trials in primary care: A practical approach. Fam Pract. 2000;17(2):192-196. https://doi.org/10.1093/fampra/17.2.192
21. Wears RL. Advanced statistics: Statistical methods for analyzing cluster and cluster-randomized data. Acad Emerg Med. 2002;9(4):330-341. https://doi.org/10.1111/j.1553-2712.2002.tb01332.x
22. McDermott JJ, Schukken YH, Shoukri MM. Study design and analytic methods for data collected from clusters of animals. Prev Vet Med. 1994;18(3):175-191. https://doi.org/10.1016/0167-5877(94)90074-4
23. Campbell MJ, Donner A, Klar N. Developments in cluster randomized trials and statistics in medicine. Stat Med. 2007;26(1):2-19. https://doi.org/10.1002/sim.2731
24. Turner EL, Prague M, Gallis JA, Li F, Murray DM. Review of recent methodological developments in group-randomized trials: Part 2 – analysis. Am J Public Health. 2017;107(7):1078-1086. https://doi.org/10.2105/AJPH.2017.303707
 PDF version
 RIS
citation
RIS
citation