What’s your interpretation? July and August 2001
What’s your interpretation? (Non-Refereed)

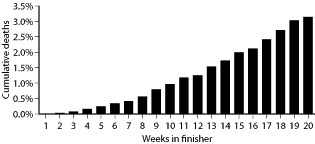
This chart illustrates data collected from finishing groups (approximately 50,000 head) closed out during a quarter, showing the cumulative percent death loss in the finisher phase by week. What could be the cause of the mortality and what can be done to control the problem and return to target levels (<2.0% mortality)?
Understanding mortality in the finishing phase
It is difficult to interpret the chart because it does not present enough information, other than the close out mortality. First, break down mortality by week to see if trends can be identified. If trends are identified, try to correlate mortality with clinical signs observed in the barns. Record analysis, trends, clinical signs, and diagnostics are important for identifying the behavior of disease processes and are critical for appropriate timing of treatment interventions.
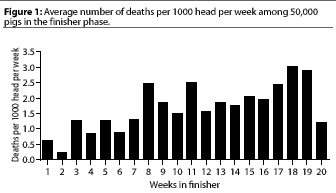
 Figure 1 shows that there were
increases in mortality in the finisher phase in the 8- to 11-week
period and in the 17- to 19-week period. The death rate also remained
elevated in the period between the two peaks.
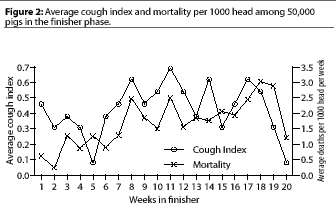
An observed level of coughing was recorded weekly as a cough index in the finishing phase, and the index was correlated with the weekly mortality values generated from the weekly grow-finish health monitor. Coughing was indexed as follows:
- 0 = no coughing while observer is walking through the finisher.
- 1 = less than 10% of the pigs cough: coughing does not persist while observer is walking through the finisher.
- 2 = 10 to 50% of the pigs cough: coughing does not persist while observer is walking through the finisher.
- 3 = more than 50% of the pigs cough: coughing remains constant the whole time observer is walking through the finisher.
 A rise in the average cough index
preceded the increase in mortality early in the finisher phase,
and rose with weekly mortality later in the finishing period.
Coughing and mortality continued through the end of the finishing
phase (Figure 2). Stool quality index scores were normal through
the finishing phase, with only isolated stool quality problems.
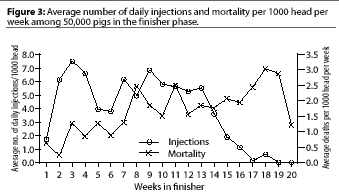
The number of pigs treated per day per week was also recorded in the weekly health monitor, allowing for comparison with the weekly mortality numbers.
 Although mortality continued to
be a problem even with the spot treating, it might have been significantly
worse if no treatments had been administered. The number of treatments
diminished in the last 3 weeks because of concerns about withdrawal
time (Figure 3).
After identifying the correlation between the pattern of mortality and clinical signs of coughing observed in the finishers, a treatment intervention plan was implemented. The treatment consisted of two pulse doses of feed grade medication for 1 week each of feed delivery, at 6 and 14 weeks in the finisher, with the intention of intervening before the peak of mortality and coughing. The options for treatment included chlortetracycline, lincomycin, and tilmicosin. Chlortetracycline was selected on the basis of farm sensitivities and price. The chlortetracycline was dosed at 22 mg per kg (10 mg per pound).
This example shows how clinical signs may be observed in a systematic manner and recorded on a weekly observation spreadsheet, which is a useful tool for identifying trends that otherwise might not be noticed. Using the spreadsheet information on mortality, clinical signs (respiratory and enteric), and response to treatments allows development of a more predicable intervention plan than can be formulated by relying on observation of clinical signs alone.
Additional diagnostic tests will be performed in the future at 8 to 11 weeks and 17 to 19 weeks in the finisher to diagnose the respiratory problem more specifically. Monitoring of the system with the weekly health recording spreadsheet will continue to measure the success of the treatment intervention in returning mortality to the target level of < 2%.
–Paul Yeske, DVM, MS
Swine Vet Center, St Peter, Minnesota
This page last updated .