 swine, crossfoster, baby pig management
Received: March 13, 2000
Accepted: July 28, 2000
Traditional veterinary interventions in the swine industry include treating and controlling infectious disease with antibiotic therapy and/or
vaccination. However, a more progressive view of veterinary services extends beyond
disease and considers management, facilities, genetics, and nutrition to maximize
profitable production on a farm. Accordingly, many swine veterinarians have
recognized the importance of incorporating these
factors into their recommendations.
Often with management interventions, the challenge lies not merely in
recognizing when to enact an intervention, but in
motivating the producer to embrace this management change and then
monitoring progress towards achieving and maintaining the new objective. Recent studies
suggest that minimal crossfostering–i.e., limiting crossfostering to the
immediate postpartum period–can increase piglet growth
rate1 and potentially minimize the impact of infectious agents, such as
porcine reproductive and respiratory syndrome virus
(PRRSV).2 However, in many herds extensive crossfostering policies are
common.3 Piglets are initially sorted, and
then disadvantaged animals are moved on a regular basis throughout lactation in
an attempt to maintain size uniformity within a litter. Disruption of the majority of
litters is common. To help implement minimal-crossfostering strategies, we have
developed a simple analytical tool that allows us
to determine when during lactation crossfostering is occurring. Using standard
data extracted from a recordkeeping program such as
PigCHAMP(R), the output of this analysis can be displayed graphically so
that it can be used as a simple on-farm motivational tool.
The problem
Recognizing and reinforcing appropriate piglet
management practice (crossfostering)
Standard piglet management information, such as that collected for
PigCHAMP(R), can be used to summarize crossfostering
of pigs, split weaning of pigs, and the use of nurse sows in a herd.
Standard PigCHAMP(R) reports, however, do
not readily provide information about the temporal patterns of crossfostering, i.e.,
the number of piglets fostered at specific ages.
Our solution
We have developed a novel analytical approach, based on data exported
from PigCHAMP(R), that allows us to
assess these temporal patterns. Our crossfostered-piglet analysis algorithm
demonstrates when during the lactation period crossfostering is occurring. This analysis
is akin to a survival analysis4,5 of the
subpopulation of piglets that will ultimately be
crossfostered. A quantity Q is defined at any time
t as:

where:
- P is the total number of piglets crossfostered
- pi is the number of piglets
crossfostered during a given time interval
- t describes the number of days
postfarrowing, and
- i is the time interval over which observations are made–usually a day.
The result of this calculation can be divided by total piglets crossfostered
during the total lactation period to yield a
proportion or normalized metric that permits the user to compare the number of piglets
being crossfostered at different time points within one herd or to make
comparisons between herds. Note that this analysis
can only be performed after the cohort is weaned.
Preparing our crossfostered piglet analysis graph
The first step to construct the graphic output of this information is to use the
Database Application feature of
PigCHAMP(R) to extract the information needed. List
the following data (List Data):
- ID,
- FARROWDATE, and
- FOSTERDATE AND FOSTERPIGS (Figure 1).
 filters to extract only the data needed for the analysis, so you should select a
time interval over which you want to perform the analysis. Specify this for
FARROWDATE. Furthermore, only FOSTER ON events need to be included, so set a
filter for FOSTERPIGS > 0.
Now the information is ready to be transferred to a spreadsheet for further
analysis (a sample Excel(TM) spreadsheet is
available for review online at
http://www.aasp.org/shap/).
- First, calculate the age at fostering
by subtracting FOSTERDATE from FARROWDATE (Figure 1).
- Next, create a distribution of the number of fostered pigs by day of
age for every day during the entire lactation period. We have used
the conditional sum function of Excel(TM) to tally the number
pigs fostered on each day postfarrowing (Figure 1).
- Then, obtain the cumulative total of pigs crossfostered by summing
the number of pigs crossfostered on each subsequent day. The crossfoster
metric is calculated for each day by subtracting the cumulative total of
piglets crossfostered between birth and the day of interest from the total
number of piglets crossfostered.
- To compare trends arising from different herds or different
time periods, divide the crossfoster metric by the total pigs fostered.
This normalized metric describes the proportion of pigs to be fostered
over time.
 Finally, plot the data versus days postfarrowing, and select a
logarithmic scale for the y axis (Figure 2).
Using the analysis: Farm examples
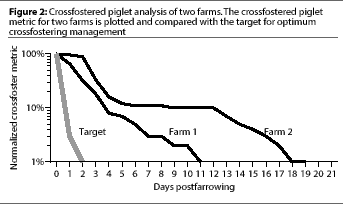
Figure 2 shows an example of the graphic output of our crossfostering analysis
using data taken from two real farms over a 4-month period in juxtaposition to
a trendline showing the target pattern of crossfostering for optimal
management. We used a logarithmic scale on the
abscissa to emphasize late crossfoster events
(i.e., crossfostering that occurred when pigs were
>= 2 days old). These are the events that we are most interested in eliminating.
By plotting the data from our algorithm in this way, the temporal pattern
of crossfostering in a herd is graphically revealed.
To assess the utility of our graphic to depict real differences in crossfostering
patterns, we performed a statistical analysis on
the data from the two real herds. The
Student’s t-test (Statistical Analysis Systems;
Cary, North Carolina) was used to test the null hypothesis that the crossfostering
pattern of these two herds was the same across the entire 4-month period represented by
the data. The survival function of pigs destined to be fostered was estimated using
the Kaplan-Meier estimator. The null hypothesis that the survival functions for the
two herds were the same was tested in PROC LIFETEST (SAS) by calculating the
log-rank statistic for each time interval and then calculating a
c2 test statistic from the log-rank statistics. The graph reflects a
significant difference (P<.0001) in the crossfostering patterns of these two
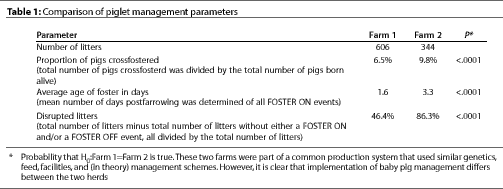
herds. This is supported by the prominent differences in piglet management between
the two farms (Table 1).

Farm 1 fostered fewer pigs
(P <.0001), fostered at a younger average age
(P <.0001), and disrupted fewer litters
(P <.0001) compared to Farm 2. The visual depiction of the differences in
the temporal patterns of crossfostering, then, reflects significant differences
between these two herds in crossfostering management.
Extent of crossfostering
Our metric focuses on the temporal patterns of crossfostering–i.e., when
during lactation crossfostering is occurring in a herd. An important but separate
question is determining to what extent crossfostering is
occurring on the farm. The extent of crossfostering may be
simply addressed by dividing the total number of crossfosters by the total number of
piglets at risk of being crossfostered (i.e., the
total number of piglets born alive)6 (Table 1).
The population of pigs at risk to be fostered does, however, change during
the course of lactation. Our crossfostering metric in theory could be divided by the
total number of pigs alive on each given day of lactation to account for such subtleties,
but this practice promises to complicate its implementation. Such changes in the
"at risk" population are a function of
preweaning mortality, which under usual conditions will diminish by only 10+/-5%
from the beginning to end of lactation. Given that most of this preweaning
mortality occurs in the immediate postpartum
period (i.e., the first 3 days of
life),7,8 the impact of changes in the population of
pigs at risk to be fostered should be minimal during late lactation (i.e., after 1
week)- our period of interest.
Discussion
Fostering is considered an important farrowing house management practice. If
performed in the immediate perinatal period, crossfostering can reduce preweaning
mortality and improve piglet
growth.9-11 The goal is to balance the nutritional needs
of the piglets with the nutrition provided by the sow. Extension of this rationale has
lead to management schemes that involve the movement of piglets between
dams throughout lactation.12 However,
several biological and behavioral factors can complicate the success of the
crossfostering strategy if it is practiced beyond the first
24 hours postfarrowing, and these may negate the possible benefits of this
management intervention.1,10,13
Social hierarchy and, specifically, teat preference within the litter begins to form
at birth and is largely settled by day 3
postfarrowing.14 Disruption of litters later in
lactation can reduce growth rates and cause behavioral problems in fostered pigs,
resident pigs, and the sow. Fostered pigs
after this age demonstrate increased
ambulation, vocalization, and increased reluctance
to engage in suckling.15 Such disruption
of the litter causes more pig-to-pig aggression, even among resident pigs. In
addition, many sows exhibit aggression toward
foster pigs, especially older pigs.16 As age at
fostering increases, these behavioral abnormalities increase, extending the time
required for fostered pigs to integrate into their new environment and
compromising their performance.1,10,13
At birth, piglets also receive passive colostral immunity against the pathogens
transmitted by the dam–the most significant source of pathogens in their
environment. Clearly, moving piglets after the
period during which passive immunity is transferred puts them at risk by moving
them into an environment containing pathogens against which they may not have
adequate protection. This is especially the case
with such infectious agents as PRRSV, since circulating antibodies may not be
protective.17 Late-fostered pigs are unable to
benefit from the passive transfer of maternal leukocytes and the cell-mediated
immunity they confer.18,19 In addition, as is the
case with PRRSV, crossfostered pigs may indeed provide a convenient vehicle for the
spread of the disease.2
The possible untoward effects associated with late crossfostering–i.e., the
disruption of the social hierarchy and the
transmission of highly infectious pathogens such
as PRRSV–arguably has a more salient impact upon the litter or at least upon
several littermates rather than necessarily upon
an individual piglet. Accordingly, the relevant measure of population at risk in
late crossfostering might be the litter rather than the piglet, and thus disrupted
litters (Table 1) may well be the best index for assessing the extent of crossfostering.
It should also be noted that data integrity is critical to successfully implementing
our crossfostering analysis. Unfortunately, FOSTER events are events notorious
for being inaccurately recorded. One simple check of data integrity is to see that there
is relatively good agreement between total FOSTER ON and FOSTER OFF events.
This production tool addresses a critical aspect of farrowing house
management: crossfostering. Our crossfostered
piglet analysis algorithm provides a convenient metric to track crossfostering.
Once graphed, temporal patterns of crossfostering are revealed and can easily be
compared to goals for crossfostering. Specifically, the graphic display can
underscore the frequency of late fostering events,
providing a simple method to help on-farm employees focus on the appropriate
execution of minimal-crossfostering strategies.
Implications
- In addition to recommending production interventions in
swine herds, an important role of the consulting swine veterinarian is
to motivate and monitor such change.
- Our crossfostered piglet
analysis, particularly when its output is graphed to show temporal patterns in
crossfostering, provides a useful tool to motivate and monitor
appropriate farrowing room management.
References-refereed
1. Straw BE, Burgi EJ, Dewey CE, Duran CO. Effects of extensive crossfostering on performance
of pigs on a farm. JAVMA. 1998; 212:855-856.
2. McCaw MB. Effect of reducing crossfostering
at birth on piglet mortality and performance during
an acute outbreak of porcine reproductive and
respiratory syndrome. Swine Health Prod. 2000;
8(1):15-21.
3. Straw BE, Dewey CE, Burgi EJ. Patterns of crossfostering and piglet mortality on
commercial U.S. and Canadian farms. Prev Vet
Med. 1998; 33:83-89.
4. Morris CR, Gardner IA, Hietala SK, Carpenter TE, Anderson RJ, Parker KM.
Seroepidemiologic study of natural transmission of
Mycoplasma hyopneumoniae in a swine herd. Prev Vet
Med. 1995; 21:323-337.
5. Benard HJ, Stark KDC, Morris RS, Pfeiffer
DU, Moser H. The 1997-1998 classical swine fever
epidemic in The Netherlands – a survival analysis.
Prev Vet Med. 1999; 42:235-248
6. Martin SW, Meek A, Willeberg P. Measurement of Disease Frequency and Production. In
Veterinary Epidemiology. Ames: Iowa State University
Press. 1987: 48-75.
7. Nielsen NC, Christensen K, Bille N, Larsen
JL. Preweaning mortality in pigs: 1. Herd
Investigations. Nord Vet-Med. 1974; 26:137-150.
8. Tubbs RC, Hurd HS, Dargatz D, Hill, G. Preweaning morbidity and mortality in the
United States swine herd. Prod 1993;
1(1):21-28.
9. English PR, Smith WJ, MacLean A. The sow
– Improving her efficiency. Ipswich, England:
Farming Press Ltd. 1977; 151-165.
10. Neal SM and Irvin KM. The effects of crossfostering pigs on survival and growth.
J Anim Sci. 1991; 69(1):41-46.
11. Svendsen J, Svendsen LS, Bengtsson AC.
Reducing perinatal mortality in pigs. In Leman AD,
Straw BE, Glock RD, et al, eds. Diseases of
Swine. 6th ed. Ames, Iowa: Iowa State University Press 1986;
813-824.
12. Cutler RS, Fahy VA, Spicer EM. Preweaning mortality. In Leman AD, Straw BE, Glock RD ,
et al, eds. Diseases of Swine.
7th ed. Ames, Iowa: Iowa State University Press 1992; 847-860.
13. Horrell I, Bennett J. Disruption of teat
preferences and retardation of growth following
cross-fostering of 1-week-old pigs. Anim
Prod. 1981; 33:99-106.
14. De Passille AMB, Rushen J, Hartsock TG. Ontogeny of teat fidelity in pigs and its relation to
competition at suckling. Can J Anim Sci. 1988;
68:325-338.
15. Horrell RI. Immediate behavioural consequences of fostering 1-week-old piglets.
J Agric Sci, Camb; 1982; 99:329-336.
16. Price EA, Hutson GD, Price MI, Borgwardt R. Fostering in swine as affected by age of offspring.
J Anim Sci. 1994; 72:1697-1701.
17. Wills R, Zimmerman J, Yoon K-J, et al.
Porcine reproductive and respiratory syndrome virus: a
persistent infection. Vet Microbiol. 1997; 55:231-240.
18. Tuboly S, Bernath S, Glavits R, Medveczky
L. Intestinal absorption of colostral lymphoid cells
in newborn pigs. Vet Immunol Immunopathol.
20:75-85.
19. Williams PP. Immodulating effects of
intestinal absorbed maternal colostral leukocytes by
neonatal pigs. Can J Vet Res. 1993; 57:1-8.
 swine, crossfoster, baby pig management
 filters to extract only the data needed for the analysis, so you should select a
time interval over which you want to perform the analysis. Specify this for
FARROWDATE. Furthermore, only FOSTER ON events need to be included, so set a
filter for FOSTERPIGS > 0.
 Finally, plot the data versus days postfarrowing, and select a
logarithmic scale for the y axis (Figure 2).
