What’s your interpretation – September and October, 1999
What’s your interpretation? |
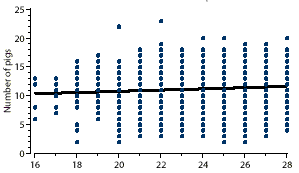
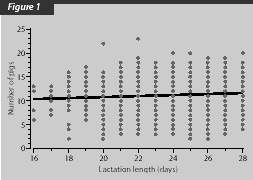
 This scatter
plot demonstrates a relationship between lactation length and
subsequent litter size (total born pigs) with 1634 observations.
The line is a linear trend between two variables. A dot may represent
more than one observation in the figure. Which methods should
you use to describe the relationship between lactation length
and subsequent litter size?
Linear regression and linear correlation analysis
Two commonly used methods, linear correlation and linear regression, can be used to analyze the data on the cover.1 Both methods allow you to describe a linear relationship between variables.
Linear correlation
Linear correlation is referred to as "correlation" or "Pearson correlation." It measures the linear relationship between two continuous variables. Outcomes from correlation analysis include correlation coefficients (r) and P values for the coefficients. The correlation coefficient is a measure of the closeness of linear relationship between two variables and always lies between -1 and 1.2 A positive coefficient indicates that two variables increase together. A negative value indicates that the large value of one variable is associated with a small value of the other variable. A 0 value means no linear relationship exists (although it is not correct to say there is no relationship because there could be a nonlinear relationship). In our example, the correlation coefficient between lactation length and litter size was 0.0854 with P value of 0.0006, indicating that subsequent litter size increased as lactation length increased.
Linear regression
Linear regression describes the linear relationship of one variable to another variable, say X and Y.2 To distinguish the two variables, we use "dependent variable" for Y and "independent variable" for X. Sometimes the term "explanatory variables" is used for independent variables. Response variables are used for dependent variables. In our example, litter size is a dependent variable, and lactation length is an independent variable. Outcomes of linear regression include intercept, slope (regression coefficient), R2, and P values for intercept and slope.
 Intercept is the value
at which the regression line crosses the Y axis. In our example,
the intercept is 8.6. If we move the Y axis of the cover figure
from 16 on the X axis to 0 and extend the linear trend line to
the Y axis, we will see a crosspoint at 8.6.
Slope is the rate of change in Y for a unit change in X. In our example, the slope is 0.11, indicating that subsequent total-born litter size increased by 0.11 pigs when lactation length increased by 1 day. The regression equation is Y = 8.7 + 0.11 X.
R-square (R2) indicates the proportion of variability of Y explained by X. R2 is between 0 and 1 or between 0% and 100%. In our example, R2 is 0.73%. One may say that lactation length explains little variation of litter size–this is correct. In swine production, it appears that improving litter size by genetic selection and management manipulation will be slow.
Difference between simple regression and correlation
There are some connections between simple regression and correlation. For instance, r = the square root of R2. The correlation coefficient is a pure number without units or dimensions. The regression coefficient, which indicates the slope of the line, has units. There is a direction between Y and X. Lactation length, for example, may influence subsequent litter size. Litter size, however, cannot affect previous lactation length.
One of the functions of regression is to predict Y using X. The Y could be significantly changed with a small change in X.
Multiple regression
Other factors, such as parity, also affect litter size as well as lactation length. We can include parity in the regression model.* Thus, there are two independent variables in the model and the model typically will have a larger R2 value. A model with a single independent variable is called simple regression. A model with more than one independent variable is called multiple regression.
Multivariate linear regression
In recent years, the word "multivariate" has been frequently misused, as has "regression," "logistic regression," or "analysis" in scientific and professional conferences or writings in veterinary medicine. Actually, these words have specific meanings when they are put together. "Multivariate analysis" refers to a number of statistical methods, which are not frequently used. The methods include multivariate linear regression, principle components, factor analysis, canonical correlation analysis, discrimination and classification, and clustering.3 "Multivariate" has been confused with "multiple" in regression. We have already discussed multiple regression above, i.e., a regression model with more than one independent variable. "Multivariate regression" means using regression models with more than one dependent variable without considering how many independent variables there are. The regression model with one dependent variable is called "univariate regression" to distinguish it from multivariate regression. Multivariate regression is much more complicated than multiple regression.
* Litter size increases from parity one through parity four or five and decreases thereafter. In statistics, it is said that litter size changes with the change in parity in quadratic fashion. Therefore, (parity)2 should be included in the model, too.
References
1. Xue JL, Dial GD, Marsh WE, Davies P, Momont H. Influence of lactation length on sow productivity. Livestock Production Science. 1993;34:253-265
2. Snedecor GW, Cochran WG. Statistical Methods. 8th ed. Ames, Iowa: Iowa State University Press, 1989.
3. Johnson RA, Wichern DW. Applied Multivariate Statistical Analysis.3rd ed. Englewood Cliffs, New Jersey: Prentice-Hall, Inc.; 1992.