What’s your interpretation? July and August 1997
What’s your interpretation? |
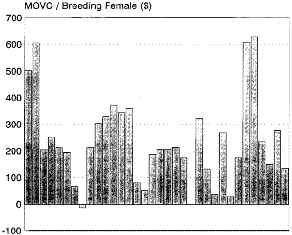
 This graphic shows the estimated financial benefit
(margin over variable cost per breeding female place) on 34 farms between
the 12 months before and the 12 months after nursery depopulation. Each
column represents one farm. How might you arrange and analyze these data
to more clearly show the expected benefit of nursery depopulation as a disease
control strategy?
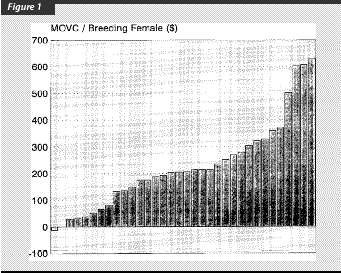
The data from the graphic shown on the front cover have been rearranged in order of increasing protability (Figure 1). Each column still represents one farm.

The mean margin over variable cost per breeding female place was $228, with a standard deviation of $167. Thirty-two of the 34 farms showed an increase in protability ranging from $30 to $628. There was a loss of $12 per breeding female on one farm, while another showed no change.
Due to the nature of this distribution, the sorted graphical presentation of these data provides substantially more useful information than the mean and standard deviation alone. In fact the mean and standard deviation are poor estimators of the central tendency and variability respectively, among the observations that comprise this distribution.
By inspecting the graphic it is easy to discern that in 32 of 34 cases (94%), the strategy showed a prot, suggesting that nursery depopulation offers a low-risk disease control strategy. Also, the median (middle) value of $205.50 (calculated in this example as the average of the values for the 17th and 18th sorted observations), is a better estimate of the expected benet than the mean of $228.
When describing distributions such as this that are clearly non-normal, percentiles and quartiles are the preferred descriptive statistics. The value for the rst quartile (or 25th percentile) is $120, indicating that 25% of the farms showed a benet of $120 or less per breeding female by implementing the depopulation strategy. However, at the other end of the scale, the third quartile (75th percentile) shows that another 25% of farms show a benet of at least $308 per breeding female.
For a more detailed account of how the benets of nursery depopulation were assessed, please see: Dee SA, Joo HS, Polson DD, Marsh WE. Evaluation of the effects of nursery depopulation on the protability of 34 pig farms. Vet Rec. 1997; 140:498500.