SHAP – v5n3 WYI
What’s your interpretation? |
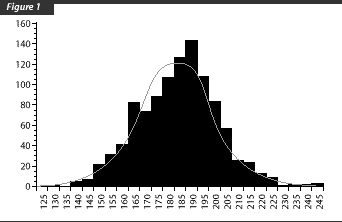
This graphic shows a histogram of liveweights of 1054 finisher pigs sold to a packer. The mean liveweight of these pigs was 251.9 lb (114.5 kg) , with a standard deviation of 23.1 lb (10.5 kg).
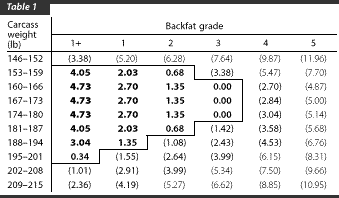
The payment matrix of this packer shows a base price for carcasses weighing
between 146 and 215 lb (66-98 kg). In addition, a premium is paid for low-backfat
carcasses weighing between 153 and 201 lb (70-91 kg). Using a conversion
factor of 74%, what is your rough estimate of the number of pigs for which
the base price or better was paid?

| The histogram (Figure 1) shows the carcass weights that correspond to the distribution of liveweights of market pigs shown on the front cover. |  |
| Adjustments to the base price ($ per cwt) paid by the packer are shown in Table 1. |  |
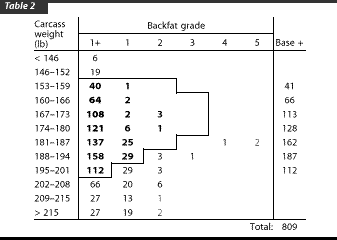
| When the carcass weight data shown in the histogram are overlaid on the matrix (Table 2), we can see that 809 of 1054 (76.8%) of pigs marketed would have qualified to receive at least the base price based solely on the carcass weight and backfat grade criteria. Further, 54 of the 1054 carcasses (5.1%) would have been very heavily discounted because they were either too heavy or too light for this packer’s pricing matrix. |  |
Using the conversion factor of 74%, carcass weights in the range of 153-201 lb (70-91 kg) correspond to liveweights of 206-272 lb (93.6-124 kg). This liveweight range corresponds almost exactly to the range of the mean minus two standard deviations (251.9 – [2 * 23.1] = 205.7) to the mean plus one standard deviation (251.9 + 23.1 = 275) of the pigs marketed. Because of this bias, this producer is marketing pigs a little on the heavy side to take full advantage of this pricing matrix. Assuming the standard deviation remained constant at 23.1, marketing pigs at an average liveweight of 242 lb +/- 1.5 standard deviations (110 kg +/-0.68) would cause the distribution of weights to more evenly overlay the payment matrix and put a higher proportion of carcasses in the $2-$4 premium categories.
How much do you know about your clients’ marketing strategies? Paying attention to reducing the variation (standard deviation) in liveweights of groups of market pigs while aiming for the center of the target (mean) will improve their chances of scoring a ‘bulls eye.’