Untitled
What’s your interpretation? |
January and February, 1997 |
Copyright (C) 1997 American Association of Swine Practitioners
Also available in PDF format.
 |
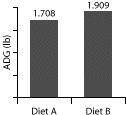
Many experimental studies compare two groups. This histogram shows the average daily gain (ADG) of two groups of pigs fed different diets. The statistical question of interest is: "What is the probability that the observed difference in ADG of 0.20 lb (0.09 kg) per day between pigs fed diet A and pigs fed diet B could have occurred by chance?" If this probability is small enough, then we may assume thatthe observed difference is not due to chance and that there is a significant effect of diet on ADG. In addition to the mean ADG for each group, what information is needed to conduct a two-sample t-test for significance? |
In this experiment, 100 pigs weighing approximately 150 lb (68 kg) were randomly allocated between two diets, fed for 48 days, then weighed again. Results are summarized in Table 1.
What is the probability that the observed difference in ADG of 0.20 lb (0.09 kg) per day between pigs fed diet A and pigs fed diet B could have occurred by chance?
To answer this question, we begin with a null hypothesis that the performance of pigs fed diet A and pigs fed diet B is not different. Then we try to show that they are different. In this instance, it is appropriate to use the Student’s t-test. This test can be applied where there are two groups to be compared and where the underlying distribution of ADG is approximately normal. We can check this by asking the computer to describe a normal curve over a histogram of the ADG data. (Figure 1)
Student’s t-test:
Step 1
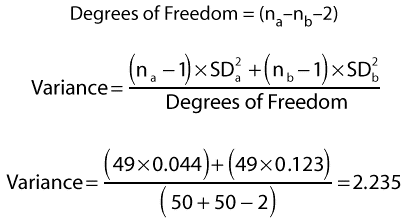
Calculate an estimate of the pooled variance for our two populations. For reasons best known to statisticians, this involves squaring the standard deviations, multiplying by sample sizes minus one, then dividing by the "degrees of freedom" :

Step 2
Once we have our estimate of variance, we can calculate our t statistic
using another impressive-looking formula:


Step 3
Looking up t = 3.47, 98 d.f., in statistical tables, we find P =.00078.
Our interpretation of P =.00078 is that the probability of our observed difference of 0.2 lb per day occurring by chance is very small indeed (78 times in 10,000!). Therefore, we can conclude that our observed difference in ADG between the two groups fed diet A and diet B is statistically significant.
Note that in addition to the mean ADG for each group, we also needed standard deviations and sample sizes (na, nb) to calculate the t statistic followed by the P-value.