Swine Health and Production — Nov ’96 WYI part 1
What’s your
|
November and December, 1996 |
Will Marsh
Copyright (C) 1996, American Association of Swine Practitioners.
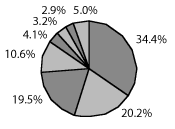
| This pie chart illustrates a breakdown of the cost structure of producing a litter of weaned pigs. The area of each segment is proportional to its value, such that the sum of all values is 100%. In this example, "feed-related expenses" account for 34.4% of the estimated total cost of production of $227.83 per litter. Before you turn to inside the back cover, take a few moments to write down a list of Þnancial accounting categories that are important contributors to weaned pig production. After "feed-related expenses," what is the second most important category? The third and the fourth largest? |  |
What’s your interpretation continues on this page…