About 40% to 65% of errors in laboratory procedures occur in the pre-analytical phase,1 including sample collection. Dependent upon the nutrient in question, a blood sample can sometimes determine nutrient deficiency or toxicity without having to euthanize animals for tissue sample collection.2 Across many published references, serum or plasma samples have been analyzed to determine the vitamin A concentrations in pigs3-6 without a consistent sampling protocol. However, serum and plasma are uniquely different biologically. Serum results from fibrin clots that form in the blood and has lower protein and fewer platelets, erythrocytes, and leukocytes than plasma.7 Research should be conducted before blood sampling to ensure that the correct collection tube type and handling methods are being used to prevent a poor diagnostic sample. For example, vitamin A is known to be a light-sensitive nutrient, and the sample is typically kept from light during lab analyses.8 Plasma collection tubes contain anticoagulants to prevent blood from clotting. Anticoagulants may affect some lab analyses.9 For example, a potassium-based anticoagulant could increase the potassium levels that are measured in the plasma.
The timing of blood collection may be important when assessing serological nutrient levels. While most pigs receive an ad libitum diet, they are not continuously eating all day. After the consumption of a meal, digestion, absorption, and redistribution of the consumed nutrients occur. When the nutrients enter the bloodstream, there is potential for a spike of that nutrient in circulation. Therefore, the time between last feed consumption and sample collection affects nutrient levels in the blood. Hemolysis is the destruction of red blood cells and can occur when blood samples undergo significant shear-force pressure, which has been shown to cause hemolysis.10 Often this is seen when blood tubes are violently shaken or if blood is collected via a syringe and then forced through a needle into a vacutainer tube. When blood undergoes hemolysis, zinc and iron concentrations significantly increase in the analyzed serum or plasma.11 Furthermore, high levels of hemolysis also result in increased chloride, magnesium, potassium, phosphorous, and total protein in analyzed samples.12 Analyses for other nutrients, such as bilirubin, uric acid, cholesterol, and triglycerides, are also affected by hemolysis,12 but fall outside the scope of this paper.
The liver is another tissue collected for analytical evaluations, as the liver serves as a main store of many vitamins and minerals.13 The liver should be frozen as soon as possible to avoid degradation of any organic compounds, including vitamins.13 While explored more in feedstuffs, vitamins tend to be sensitive to high temperatures, light exposure, and pH changes.14 Thus, freezing liver samples in a dark environment until the time of analysis is the most ideal for nutrient analysis. Keeping liver samples frozen becomes problematic if they need to be mailed for submission to a veterinary diagnostic laboratory, as weather and human error can cause package delivery to be postponed during overnight shipping.
These sampling and handling techniques that can affect vitamin and mineral analysis in samples were addressed in 5 experiments. The overall objective of the experiments was to better understand how sample collection, handling, and storage affects nutrient analysis. Experiment 1 evaluated whether vitamin concentrations were different when either serum or plasma were collected and how vitamin concentrations may change during light exposure. Experiment 2 assessed circulating blood nutrient concentrations post meal consumption. Experiment 3 compared vitamin concentrations in hemolyzed versus non hemolyzed plasma. Experiment 4 evaluated the vitamin and mineral degradation rate in the pig liver over 12 hours when held at various temperatures. Experiment 5 evaluated the impact of delayed sample processing on vitamin levels in serum and the liver.
Animal care and use
All procedures in this study adhered to guidelines for the ethical and humane use of animals for research and were approved by the Institutional Animal Care and Use Committee at Iowa State University (No. 20-087, 22-154, and 20-123).
Materials and methods
Metabolites chosen for analysis across studies related back to previous work conducted to address questions about sample collection that specifically evaluated a nutrient in question. Unless otherwise stated, pigs were group housed with ad libitum access to feed and water.
Experiment 1. Plasma vs serum with and without light exposure
A total of 4 blood samples were taken from 8 pigs (approximately 6 months old, 115-120 kg, n = 4 barrows and 4 gilts; PIC 337 × 1050 genetics) via jugular venipuncture. Two blood samples were collected for serum using 10-mL, red-top tubes without gel separator (BD Vacutainer; Becton Dickinson) and 2 were collected for plasma using 10-mL tubes with tripotassium ethylenediaminetetraacetic acid (K3-EDTA; BD Vacutainer; Becton Dickinson). One of each type of blood sample was exposed to light prior to centrifugation, while the other blood tube was wrapped in aluminum foil immediately after the blood sample was collected to keep light from the sample. All samples were chilled by laying the samples on ice until the time of processing. Light- exposed samples were exposed for 4 hours to light from 2 fluorescent bulbs (SYLVANIA, Supersaver Deluxe Cool White F34CWX/SS, 34w, 4100K, 1925 lumens, 1219.2 mm; and SYLVANIA, Ecologic, Designer F34/D35/SS/ECO, 34w, 3500K, 2800 lumens, 1219.2 mm). The samples were placed approximately 3 m from the light source and rotated every hour to ensure complete exposure of the sample to the light. The general light intensity in the room was approximately 102.3 lux measured by a luxmeter (AOPUTTRIVER; Model: AP-881D) in the location of the sample. Direct sunlight was avoided to better replicate the farm’s light source. Blood was centrifuged (Sorvall Legend XFR, ThermoFisher Scientific) at 2000g for 10 minutes at 4°C. Samples were stored at -80°C until further analysis.
Experiment 2. Pharmacokinetics of vitamins A and E in serum after a meal
Eight gilts (mean [SD] weight: 98 [5] kg; PIC 337 × 1050 genetics) were individ-ually housed in pens and fasted for 12 hours. Prior to a meal, a blood sample was taken via jugular venipuncture using a 10-mL, red-top serum tube without a gel separator. Water was provided ad libitum throughout the study. A diet was provided at a level of 4% of the pig’s body weight and consisted of a standard corn and soybean meal-based diet that met or exceeded NRC requirements.15 Pigs were allowed access to feed for 1 hour, and then the feed was removed from the pen. Blood samples were taken at hours 1, 2, 3, 4, 6, and 12 after collecting the initial blood sample. After the last blood sample, feed was returned to the animal. All blood was allowed to clot at room temperature (approximately 20°C) for less than 4 hours before being moved to 4°C. All samples were centrifuged (2000g for 10 minutes at 4°C ) within 6 hours of collection and stored at -80°C until further analysis.
Experiment 3. Hemolysis
Six gilts (approximately 90 kg; PIC 337 × 1050 genetics) on a common corn and soybean meal diet that met or exceeded NRC requirements15 were sampled via jugular venipuncture using two, 10-mL plasma tubes (K3-EDTA blood tubes). The 2 blood tubes were re-aliquoted into 3 test tubes, making sure to mix blood from each collection blood tube using a transfer pipette (CAT: 13-711-7M; Fisher Scientific). One aliquot was centrifuged without any manipulation, representing a low level of hemolysis. The second aliquot was drawn into a sterile 10-mL syringe with a 26-gauge, 0.5-inch needle and expelled 5 times, which was defined as a medium level of hemolysis. Finally, the last aliquot was subjected to sonication for 5 seconds (Model: GE 130PB; outage = 02; Cole Parmer), which was defined as a high level of hemolysis. All blood was centrifuged at 2000g for 10 minutes at 4°C. The plasma was isolated from the sample and stored at -80°C until further analysis.
Experiment 4. Liver degradation
Liver samples were collected from 6 gilts (approximately 90 kg; PIC 337 × 1050 genetics) fed a common corn and soybean meal diet with vitamin inclusion that met or exceeded NRC recommendations.15 Gilts were euthanized via captive bolt followed by exsanguination. The entire left lobe of the liver was divided into 10 equal sections, placed in Whirl-Pak bags (15.24 cm × 22.86 cm) that were then subjected to different temperatures for different lengths of time. One liver section was immediately snap frozen and stored at -80°C until further analysis. Other sections of the liver were stored in the freezer (-20°C), the refrigerator (4°C), or at room temperature (20°C) for either 3, 6, or 12 hours. At the designated time, the section of the liver was moved to -80°C for further analysis of vitamin concentrations.
Experiment 5. Long-term degradation
Blood was collected into 3 solid red-top blood tubes (10 mL) from 6 barrows (approximately 10 kg; PIC 337 × 1050 genetics) during exsanguination. The right medial lobe of the liver was collected and divided into 3 equal sections and stored in Whirl-Pak bags (15.24 cm × 22.86 cm). Blood and liver samples were placed into a Styrofoam cooler with 4 ice packs (ThermoSafe PolarPack; 13.97 cm × 15.24 cm; Sonoco) and stored until time of processing. On the designated day (day of collection [D0], 1 day after collection [D1], and 2 days after collection [D2]), 1 blood tube and 1 liver sample were removed from the cooler. The blood sample was centrifuged at 2000g for 10 minutes at 4°C. The serum was separated from the red blood cells and stored in 1.5-mL tubes (CAT: 05-408-129; Fisher Scientific). The serum and liver sections were stored at -80°C until further analysis.
Sample analysis
All samples were analyzed for concentrations of vitamins A, E, D, or a combination of the 3, and trace minerals where appropriate, at Iowa State University’s Veterinary Diagnostic Laboratory as described by Greiner et al.2 Vitamin A was analyzed for the metabolite retinol, vitamin E was analyzed for the metabolite alpha-tocopherol, and vitamin D was analyzed for the metabolite 25-hydroxyvitamin D3.
Statistical analysis
All data were analyzed using the GLIMMIX procedure in SAS 9.4 (SAS Institute) except where otherwise indicated. For all statistical analyses, the animal was the experimental unit and used for repeated measures. Least squares means were reported with a Tukey adjustment, and P ≤ .05 were considered significant, while .05 < P ≤ .10 were considered a tendency. Data analysis for each experiment varied and therefore additional statistical analysis conducted is further described here.
Experiment 1. Fixed effects include blood tube and light exposure interaction and sex.
Experiment 2. The IML procedure was used to obtain contrast coefficients to account for the unequal spacing in sample collection. Time was a fixed effect within the model.
Experiment 3. The degree of hemolysis was a fixed effect. Observations for iron and manganese were log-transformed for normality and converted back for reporting. Additionally, there was an outlier in the iron analysis in which one sample in the medium hemolysis group was more than 3 standard deviations from the mean of the other samples within the treatment. The observation was removed to obtain normal data for analysis using the Shapiro Wilks test.
Experiment 4. Fixed effects include temperature and time interaction.
Experiment 5. Time was the fixed effect within the model. One pig was removed from the analysis as alpha-tocopherol in the serum was more than 3 standard deviations below the mean of other samples from the same treatment and the analyzed level was 0.2 ppm when other measurements for the same pig were approximately 2.0 ppm.
Results
Plasma vs serum with and without light exposure
The concentration of vitamin A (retinol) in either plasma or serum tubes was not significantly different (P > .05, Table 1) in relation to light exposure. However, there was a tendency (P = .07) for retinol to be lower in serum tubes with no light exposure compared to other collection methods (0.20 ppm vs 0.21 ppm, respectively). Retinol tended (P = .09) to be higher for barrows than for gilts (0.22 ppm vs 0.19 ppm, respectively). There was no difference (P > .05, Table 1) in blood tube type, light exposure, the interaction between the two, or sex for vitamin E (alpha-tocopherol). There was an interaction for Vitamin D (25-hydroxyvitamin D3) between blood tube type and light exposure (P = .03) in which serum blood tubes that were both exposed to light and not (34 ng/mL of 25-hydroxyvitamin D3 for both serum samples) were higher than both plasma samples, but plasma not exposed to light was higher than plasma exposed to light (32 ng/mL and 30 ng/mL, respectively). Vitamin D (25-hydroxyvitamin D3) had a tendency (P = .08, Table 1) to be higher in tubes that were not exposed to light compared to tubes that were exposed to light (33 ng/mL vs 32 ng/mL, respec- tively). Additionally, 25-hydroxyvitamin D3 was (P < .001) higher in serum tubes versus plasma tubes (34 ng/mL vs 31 ng/mL, res-pectively). Furthermore, 25-hydroxy- vitamin D3 was higher (P = .04) in barrows than in gilts (43 ng/mL vs 22 ng/mL, respectively).
| Parameter | Barrow | Gilt | SEM | P | ||||||||||
|---|---|---|---|---|---|---|---|---|---|---|---|---|---|---|
| Serum | Plasma | Serum | Plasma | |||||||||||
| Light | No light | Light | No light | Light | No light | Light | No light | Exposure | Tube | Sex | Exposure × Tube | Exposure × Tube × Sex | ||
| Retinol, ppm | 0.22 | 0.21 | 0.22 | 0.23 | 0.20 | 0.19 | 0.19 | 0.19 | 0.009 | .29 | .14 | .09 | .07 | .29 |
| 25-hydroxyvitamin D3, ng/mL | 44 | 44 | 40 | 42 | 23 | 23 | 21 | 22 | 5.3 | .08 | < .001 | .04 | .03 | .77 |
| Alpha-tocopherol, ppm | 1.40 | 1.40 | 1.33 | 1.38 | 1.43 | 1.43 | 1.43 | 1.28 | 0.141 | .65 | .26 | .95 | .65 | .37 |
Pharmacokinetics of vitamins A and E in serum after a meal
Over time, the vitamin serum concentrations had linear and quadratic effects (P < .05, Table 2). Alpha-tocopherol peaked at hour 4, whereas retinol peaked at hour 6.
| Hour post consumption | P | |||||||||||
|---|---|---|---|---|---|---|---|---|---|---|---|---|
| Parameter | 0 | 1 | 2 | 3 | 4 | 6 | 12 | SEM | Hour | Linear | Quadratic | Cubic |
| Retinol, ppm | 0.24 | 0.24 | 0.24 | 0.24 | 0.24 | 0.25 | 0.22 | 0.009 | .02 | .02 | .02 | .21 |
| Alpha-tocopherol, ppm | 2.2 | 2.3 | 2.2 | 2.2 | 2.5 | 2.0 | 1.8 | 0.191 | < .001 | < .001 | .03 | .10 |
Hemolysis
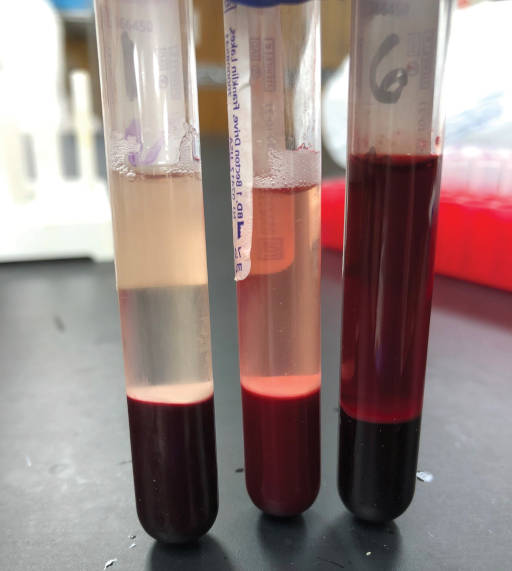
Differences found across all parameters analyzed were dependent upon the level of sample hemolysis and the analyzed nutrient. The visual difference of the level of hemolysis is shown in Figure 1. There was no difference (P > .05, Table 3) between the low and medium levels of sample hemolysis for alpha-tocopherol, calcium, copper, magnesium, manganese, phosphorous, potassium, selenium, and zinc. However, there was a difference (P < .05) between the previously listed parameters and the high level of sample hemolysis. For iron and molybdenum, there was a difference (P < .01) between all degrees of sample hemolysis. At a low level of sample hemolysis, retinol was different (P < .05) from the medium and high levels of sample hemolysis. However, the medium and high level of sample hemolysis was not different from each other (P > .05).
| Parameter | Level of hemolysis* | SEM | P | ||
|---|---|---|---|---|---|
| Low | Medium | High | |||
| Vitamins | |||||
| Retinol, ppm | 0.26a | 0.24b | 0.23b | 0.014 | < .001 |
| Alpha-tocopherol, ppm | 1.78a | 1.55a | 1.00b | 0.101 | < .001 |
| Minerals | |||||
| Calcium, ppm | 115.1a | 111.9a | 95.8b | 2.38 | < .001 |
| Copper, ppm | 1.8a | 1.7a | 1.6b | 0.13 | .005 |
| Iron, ppm | 1.8c | 2.9b | 159.2a | 1.04 | < .001 |
| Magnesium, ppm | 18.8b | 18.9b | 38.2a | 3.04 | < .001 |
| Manganese, ppb | 5b | 5b | 8a | 1.1 | .02 |
| Molybdenum, ppb | 13a | 12b | 11c | 0.4 | < .001 |
| Phosphorus, ppm | 59.2b | 58.2b | 125.9a | 3.48 | < .001 |
| Potassium, ppm | 1107.1b | 1070.3b | 1725.5a | 30.35 | < .001 |
| Selenium, ppb | 280b | 268b | 359a | 11.7 | < .001 |
| Zinc, ppm | 4.2b | 4.1b | 4.8a | 0.22 | < .001 |
* Low hemolysis: sample was not manipulated after collection; medium hemolysis: sample was subjected to aspiration by drawing whole blood into a sterile 10-mL syringe with a 26-gauge, 0.5-inch needle and expelled 5 times; high hemolysis: whole blood was subjected to sonication for 5 seconds.
a,b,c For each parameter measured, differing superscripts indicate a statistical difference between hemolysis levels, P < .05.
Liver degradation
There were no differences (P > .05, Table 4) in the liver retinol and alpha- tocopherol levels over 12 hours at varying temperatures.
| Parameter | Temperature* | SEM | P | |||||||||
|---|---|---|---|---|---|---|---|---|---|---|---|---|
| Liquid N2 | -20°C | 4°C | 20°C | |||||||||
| 0h | 3h | 6h | 12h | 3h | 6h | 12h | 3h | 6h | 12h | |||
| Retinol, ppm | 44 | 46 | 42 | 45 | 44 | 45 | 46 | 47 | 45 | 47 | 4.7 | .80 |
| Alpha-tocopherol, ppm | 9.8 | 10.2 | 10.0 | 9.7 | 9.8 | 9.8 | 10.1 | 9.7 | 10.0 | 9.7 | 0.93 | .93 |
Long-term degradation
There were no differences (P > .05, Table 5) in retinol and alpha-tocopherol concentrations in serum and liver samples when processed either the day of, 1 day after, or 2 days after collection.
| Parameter | Days post collection | SEM | P | ||
|---|---|---|---|---|---|
| 0 | 1 | 2 | |||
| Serum, ppm | |||||
| Retinol | 0.26 | 0.26 | 0.27 | 0.018 | .28 |
| Alpha-tocopherol | 2.20 | 2.36 | 2.28 | 0.190 | .16 |
| Liver, ppm | |||||
| Retinol | 12 | 11 | 12 | 0.6 | .77 |
| Alpha-tocopherol | 1.74 | 2.32 | 2.08 | 0.295 | .20 |
Discussion
From the differences detected among the blood tubes and light exposure for vitamin analysis, results received from a diagnostic laboratory may be influenced by the blood tube type, light exposure, or both. Vitamins A, D, and E in feedstuffs have been reported to have light sensitivity,16 but there has been little documentation if this phenomenon occurs in biological samples. It has been recommended that collected blood should not be stored in areas of direct sunlight.17 The differences observed with vitamin D metabolites across different blood tubes and light exposure could be due to the metabolites in the blood reacting with the anticoagulant, as plasma samples had lower 25-hydroxyvitamin D3 than serum. However, vitamin D metabolite levels in blood collected with different types of blood tubes measured by liquid chromatography-tandem-mass spectrometry have been inconsistent across studies. Zelzer et al18 summarized studies that reported conflicting findings concerning the impact of plasma or serum blood tube use to analyze vitamin D metabolites. While some studies reported no differences between serum or plasma, others found that either serum or plasma had higher levels of vitamin D metabolites. Studies have also reported that blood tube types can impact vitamin and mineral analysis. Blood tubes with royal blue caps are recommended for mineral analysis. These tubes do not contain trace minerals in the materials used to make them, while other blood tubes may contain minerals that will interfere with the mineral analysis.19 Thus, it is vital to communicate with the diagnostic laboratory how the sample was collected on the farm or consult with the diagnostic laboratory prior to sample collection to ensure the sample is taken correctly. Vitamin D metabolites were significantly lower in females than males; however, the analyzed levels were similar to previously reported vitamin D levels (approximately 26 ng/mL).20 Additionally, it has been reported that sows have lower serum vitamin D levels than boars,20 so vitamin D metabolite differences seen in the current study could be due to sexual maturation.
The results of this study suggest active absorption and recirculation of vitamins A and E in the pig after a meal. If a pig is limit fed, sampling for retinol and alpha-tocopherol should be done before the pig consumes feed to avoid any nutritional spikes. This study showed a spike in retinol and alpha-tocopherol at 6 and 4 hours, respectively, after a meal. However, diet composition can alter the time it takes for lipophilic food components to be absorbed.21 It is generally accepted that fat-soluble vitamins are incorporated into micelles22 and absorbed with fat in the upper half of the small intestine.23 Factors such as the bioavailability of lipids to be emulsified into micelles can impact the time it takes for the fat to be absorbed21 and, subsequently, the time to absorb fat-soluble vitamins. Sampling before the animal eats helps ensure that there is no spike of nutrients traveling through the blood at the time the sample is taken, although this may result in reporting of lower levels of nutrients. If sampling a limit-fed pig, it is best to note the time the animal last ate and when the sample is taken to account for any potential highs and lows that might appear in a diagnostic report.
There is a wide range of hemolysis that can exist during sample collection,24 and exploring all degrees of hemolysis falls outside the scope of the study reported here. Three levels of hemolysis were selected for discussion within this study. Sonicating the sample allowed for extreme hemolysis, ensuring any potential differences in the analyses would be detected. Spectrophotometric interferences with other laboratory methods can be produced from hemolyzed samples,25 and thus it is best to avoid hemolysis to ensure laboratory methods are executed properly. Hemolysis results from this study were similar to previous studies where an increase in iron,11 zinc,11 potassium,1 and phosphorous1 and a decrease in vitamin E were observed.26 To ensure blood sample results are accurate, it is recommended to avoid any hemolysis of the blood sample. Reports of altered nutrient analysis have been made with even mild hemolysis,1 which was also observed with the results of this study. A syringe has the potential to create enough pressure to cause hemolysis when used with a large bore needle.27 Thus, care should be taken if blood samples are collected using a needle and syringe to avoid hemolysis.
Organic compounds, such as vitamins, will degrade over time.13 However, low temperatures minimize the occurrence of the degradation process.28 It is a common practice to keep samples on ice and freeze them as soon as possible as there is much still unknown about vitamin degradation in collected biological samples. In this study, storing samples at room temperature (approximately 20°C) for 12 hours did not appear to impact degradation of the tested vitamins. The lack of difference in detectable retinol and alpha-tocopherol concentrations within the liver would suggest that the vitamins are stable for a period after tissue degradation has started.
Retinol and alpha-tocopherol concentrations of tissues left in a Styrofoam cooler for up to 2 days were not different from measurements made on the same day of collection. The authors hypothesize that the ice packs created a cold enough environment in the cooler to delay any significant degradation of retinol and alpha-tocopherol in the biological samples. Whole blood has been reported to be held at room temperature (approximately 22°C) for platelet analysis. Leaving whole blood at room temperature is recommended for facilities that are designed to process bulk blood, such as from blood donors, where the room temperature is kept at 22°C (± 2°C).17 Styrofoam coolers are made from a polystyrene foam, which is listed as a component used in most insulated containers used to transport blood.17 A well-insulated container can help prevent excessive environmental heat from warming the samples within the container.17 Once more, it is recommended that samples be kept on ice and frozen as soon as possible. Organic compounds will degrade over time,13 but keeping the tissue in a cold environment creates unfavorable conditions for degradation.28 The coolers and ice packs in this study were stored at ambient temperatures over 2 days. Coolers transported in non-temperature- controlled environments may experience a higher degree of degradation of organic compounds, especially during summer when temperatures are warmer.
It is best to ensure that the correct tube is used to collect blood for the analysis in question. The time in which blood samples are taken should be considered when collecting from limit-fed animals to potentially explain any high or low values that could appear in a diagnostic report, and all blood samples should be collected directly into a blood tube to avoid the potential of hemolysis. While both liver and blood samples do not show significant retinol and alpha-tocopherol degradation after 2 days in a cooler with ice packs, storing and processing samples as quickly as possible is still recommended.
Implications
Under the conditions of this study:
- Blood tube and timing of collection can affect blood vitamin analysis.
- Samples can sit for up to 2 days with no difference in vitamin concentrations.
- Hemolysis will affect vitamin and mineral analyses in blood.
Acknowledgments
Conflict of interest
None reported.
Disclaimer
Scientific manuscripts published in the Journal of Swine Health and Production are peer reviewed. However, information on medications, feed, and management techniques may be specific to the research or commercial situation presented in the manuscript. It is the responsibility of the reader to use information responsibly and in accordance with the rules and regulations governing research or the practice of veterinary medicine in their country or region.
References
1. Bhargava S, Singla P, Manocha A, Kankra M, Sharma A, Ahirwar A, Ralhan R, Thapliyal U, Mehra P. The hemolyzed sample: To analyse or not to analyse. Indian J Clin Biochem. 2020;35(2):232-238. https://doi.org/10.1007/s12291-019-00821-4
2. Greiner L, Elefson S, Radke S, Hagen C, Humphrey D, Becker S. A survey of vitamin and trace mineral ranges for diagnostic lab reporting from conventionally raised swine. J Swine Health Prod. 2022;30(5):282-291. https://doi.org/10.54846/jshap/1286
3. Ching S, Mahan DC, Wiseman TG, Fastinger ND. Evaluating the antioxidant status of weanling pigs fed dietary vitamins A and E. J Anim Sci. 2002;80:2396-2401. https://doi.org/10.1093/ansci/80.9.2396
4. Jang YD, Rotering MJ, Isensee PK, Rinholen KA, Boston-Denton CJ, Kelley PG, Stuart RL. Distribution of injected fat-soluble vitamins in plasma and tissues of nursery pigs. Asian-Australas J Anim Sci. 2020;33(12):1985-1990. https://doi.org/10.5713/ajas.19.0987
5. Alam BS, Brown LR, Alam SQ. Influence of dietary fats and vitamin E on plasma and hepatic vitamin A and beta-carotene levels in rats fed excess beta-carotene. Nutr Cancer. 1990;14:111-116. https://doi.org/10.1080/01635589009514084
6. Anderson LE, Myer RO, Brendemuhl JH, McDowell LR. The effect of excessive dietary vitamin A on performance and vitamin E status in swine fed diets varying in dietary vitamin E. J Anim Sci. 1995;73:1093-1098. https://doi.org/10.2527/1995.7341093x
7. Issaq HJ, Xiao Z, Veenstra TD. Serum and plasma proteomics. Chem Rev. 2007;107(8):3601-3620. https://doi.org/10.1021/cr068287r
8. Nierenberg DW, Lester DC. Determination of vitamins A and E in serum and plasma using a simplified clarification method and high-performance liquid chromatography. J Chromatogr. 1985;345:275-284. https://doi.org/10.1016/0378-4347(85)80165-1
9. Benjamin MM. Outline of Veterinary Clinical Pathology. 3rd ed. The Iowa State University Pess; 1978.
10. Nevaril CG, Lynch EC, Alfrey Jr CP, Hellums JD. Erythrocyte damage and destruction induced by shearing stress. J Lab Clin Med. 1968;71:784-790.
11. Killilea DW, Rohner F, Ghosh S, Otoo GE, Smith L, Siekmann JH, King JC. Identification of a hemolysis threshold that increases plasma and serum zinc concentration. J Nutr. 2017;147(6):1218-1225. https://doi.org/10.3945/jn.116.247171
12. Koseoglu M, Hur A, Atay A, Çuhadar S. Effects of hemolysis interferences on routine biochemistry parameters. Biochem Med (Zagreb). 2011;21(1):79-85. https://doi.org/10.11613/bm.2011.015
13. Combs Jr GF. The Vitamins: Fundamental Aspects in Nutrition and Health. 4th ed. Academic Press; 2012.
*14. Menegat MB, Goodband RD, De-Rouchey JM, Tokach MD, Woodworth JC, Dritz SS. Vitamin Sources for Swine Diet. Kansas State University Swine Nutrition Guide. Published 2019. Accessed October 4, 2022. https://www.asi.k-state.edu/extension/swine/swinenutritionguide/pdf/KSU%20Vitamin%20Sources%20for%20Swine%20Diets%20fact%20sheet.pdf
15. National Research Council. Nutrient Requirements of Swine. 11th ed. National Acadedmy Press; 2012.
*16. Menegat MB, Goodband RD, DeRouchey JM, Tokach MD, Woodworth JC, Dritz SS. Vitamin stability. Kansas State University Swine Nutrition Guide. Published 2019. Accessed November 14, 2022. https://www.asi.k-state.edu/extension/swine/swinenutritionguide/general_nutrition_principles/vitaminstability.html
17. Hardwick J. Blood storage and transportation. ISBT Sci Ser. 2008;3:177-196. https://doi.org/10.1111/j.1751-2824.2008.00196.x
18. Zelzer S, Goessler W, Herrmann M. Measurement of vitamin D metabolites by mass spectrometry, an analytical challenge. J Lab Precis Med. 2018;3:99. https://doi.org/10.21037/jlpm.2018.11.06
19. Corn R. Trace Mineral Testing. Kansas State Veterinary Diagnostic Laboratory. Published April 2019. Accessed November 14, 2022. https://www.ksvdl.org/resources/news/diagnostic_insights_for_technicians/april2019/trace-mineral-testing.html
20. Arnold J, Madson DM, Ensley SM, Goff JP, Sparks C, Stevenson GW, Crenshaw T, Wang C, Horst RL. Survey of serum vitamin D status across stages of swine production and evaluation of supplemental bulk vitamin D premixes used in swine diets. J Swine Health Prod. 2015;23(1):28-34.
21. McClements DJ, Decker EA, Park Y, Weiss J. Designing food structure to control stability, digestion, release and absorption of lipophilic food components. Food Biophys. 2008;3(2):219-228. https://doi.org/10.1007/s11483-008-9070-Y
22. Iqbal J, Hussain MM. Intestinal lipid absorption. Am J Physiol Endocrinol Metab. 2009;296:1183-1194. https://doi.org/10.1152/ajpendo.90899.2008
23. Reboul E. Absorption of vitamin A and carotenoids by the enterocyte: Focus on transport proteins. Nutrients. 2013;5(9):3563-3581. https://doi.org/10.3390/nu5093563
24. Ni J, Zhu W, Wang Y, Wei X, Li J, Peng L, Zhang K, Bai B. A reference chart for clinical biochemical tests of hemolyzed serum samples. J Clin Lab Anal. 2021;35(1):e23561. https://doi.org/10.1002/jcla.23561
25. Carraro P, Servidio G, Plebani M. Hemolyzed specimens: A reason for rejection or a clinical challenge? Clin Chem. 2000;46(2):306-307. https://doi.org/10.1093/clinchem/46.2.306
26. Hooser SB, McCarthy JM, Wilson CR, Harms JL, Stevenson G, Everson RJ. Effects of storage conditions and hemolysis on vitamin E concentrations in porcine serum and liver. J Vet Diagn Invest. 2000;12:365-368. https://doi.org/10.1177/104063870001200412
27. Sharp MK, Mohammad SF. Scaling of hemolysis in needles and catheters. Ann Biomed Eng. 1998;26:788-797. https://doi.org/10.1114/1.65
*28. Ahn HK, Glanville TD, Crawford BP, Koziel JA, Akdeniz N. Evaluation of the biodegradability of animal carcasses in passively aerated bio-secure composting system. ASABE Paper No. 074037. In: ASABE Annual International Meeting. 2007
* Non-refereed references.
 PDF version
 RIS
citation
RIS
citation