Water function, quality,1 and quantity are essential to the individual pig’s health and welfare.2 Water is essential for a variety of biochemical reactions to function correctly, it supplies a protective cushioning to the nervous system (ie, cerebral-spinal fluid), and is required for the lubrication of joints.3 In addition, nutrients are transported to tissues via water and waste products from cell metabolism are removed.
Water accounts for approximately 80% of body weight at birth and declines to 50% in a finished market pig.4 Nursery pigs require 2.65 L/pig/day at a flow rate of 0.24 to 0.47 L/min.5 If 10% or more of body water is lost, it can result in devastating consequences, such as severe dehydration, salt poisoning, and, in extreme cases, death.6,7 Drinking is defined as voluntary oral ingestion of liquids8 and refers to total water consumption. Drinking behavior develops over the first few days post weaning,2,9 with pigs engaging in 60 drinking visits per day (≤ 10 s/bout).9 Water intake follows a stable diurnal pattern at a group level10 and can be influenced by drinker design,11,12 diet,13,14 environmental conditions,15 health status,16 social competition,17 drinker maintenance, and location.2
Although water quantity is critical for nursery pig health and overall welfare, limited scientific research has been published that evaluates optimal pig-to-water resource ratios (ie, pig to drinker) and where it is best to place water resources within a pen.2 A current recommendation is 1:10 drinker to pig ratio,18 however these ratios of pig to drinker are often higher on farm (Paul DuBois, DVM, email communication, 2006). Andersen et al10 considered individual pig drinking patterns as a potential tool for disease monitoring. Pigs were housed as either 3 or 10 pigs/pen with 1 water nipple. The authors reported that overall, pigs spent 594 seconds at the nipple during 24 hours distributed among 44 visits. During this period, 5 L of water were used, of which > 30% was wasted. With 3 pigs/water nipple, pigs visited the drinker less often and drank less. This study was useful in comparing different group sizes and the effects on water consumption, but a limitation was that it did not offer more drinking options in the pen, thus decreasing the number of nursery pigs per drinker.
Therefore, the objectives of this study were to determine the effect of 1, 2, or 3 drinkers/pen on the frequency and duration of drinker visits, aggressive interactions in the drinker vicinity, drinker location preference, and water disappearance for 7-week-old nursery pigs.
Materials and methods
Animals and location
This project was approved by the Iowa State University Animal Care and Use Committee and conducted at a commercial nursery facility in central Missouri. A total of 225 PIC crossbred (mean [SD] 21 [4] days of age) gilts weighing 5.38 (2.65) kg were assigned to pens by body weight (all piglets were weighed individually on an electronic scale accurate to 0.1 kg; PS250 Platform Scale; Salter Brecknell). Gilts originated from a single, high-health status sow herd that was negative by serological testing for pseudorabies, porcine reproductive and respiratory syndrome virus, and Mycoplasma hyopneumoniae; and where suckling piglets had access to a stainless steel nipple water drinker until they were weaned.
Gilts were housed in nursery pens that measured 1.83 m × 3.05 m, providing 0.22 m2/pig meeting space recommendations for pigs at this production stage.19 Steel penning was used for dividers and were 3.1 m long × 0.91 m high. Tenderfoot (Tandem Products, Inc) flooring was utilized in all pens and pigs had ad libitum access to a corn-soy diet formulated to meet or exceed NRC requirements.20 Diets were provided through a 5-hole stainless steel feeder 68.6 cm high × 91.4 cm long. The building was curtain sided and pigs received natural light. Farm personnel observed all pigs at 7:30 am and 3:30 pm. Environmental temperature was electronically recorded using data loggers (Hobo Pro series; Forestry Supplies, Inc). A data logger was suspended over each pen from the feed auger at a height of 92 cm from the ground. Ambient temperature (°C) and relative humidity (%) were recorded at 10-minute intervals for the duration of the trial. Mean environmental measurements were 24.8°C and 51.0% relative humidity for the duration of the trial.
Treatments and experimental design
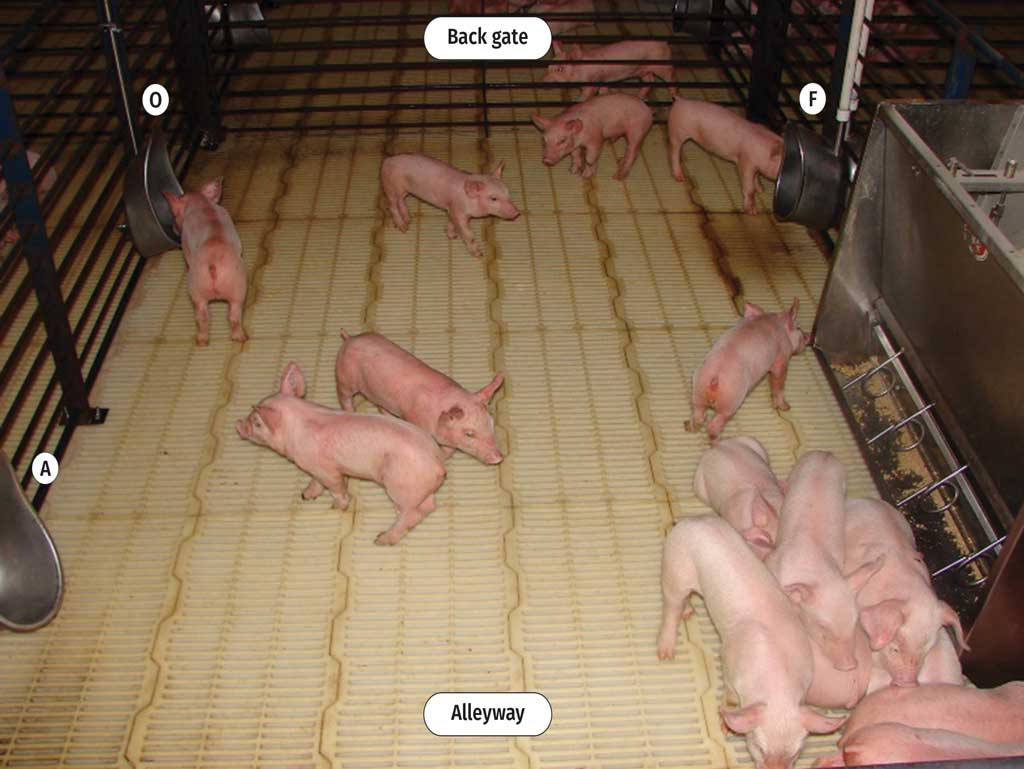
A total of 9 pens were used (n = 3/treatment) with twenty-five, 7-week-old nursery pigs/pen. Each pen contained 1, 2, or 3 stainless steel nipple cup drinkers that measured 12.7 cm deep × 28.6 cm high × 17.8 cm wide (Farmweld DRIK-O-MAT Wean-to-Finish Cup; Farmweld, Inc). Treatment 1 was defined as 1 drinker/pen (1:25 drinker to pig ratio) and the drinker was positioned on the same side as the feeder and near the back gate (F; Figure 1). Treatment 2 was defined as 2 drinkers/pen (1:12 drinker to pig ratio) and the drinkers were positioned at F and close to the back gate opposite the feeder (O; Figure 1). Treatment 3 was defined as 3 drinkers/pen (1:8 drinker to pig ratio). Drinker positions were F, O, and across from the feeder next to the alleyway gate (A; Figure 1).
Behavior equipment and collection
One day prior to behavior recording, each gilt was identified with a unique number placed on its back between the scapula using an animal safe crayon (Laco Twist-Stick Livestock Marker; LA-CO). One 12 V black and white close circuit television camera (Model WV-CP484, Panasonic Matsushita Co Ltd) was positioned over each drinker. Behavior was recorded between 7:00 am and 12:59 pm over the 2 consecutive trial days (2700 hours of data recorded; RECO-204; Darim Vision Corp) at 1 frame/s. Behavioral video acquisition was collected in real time using the Observer software by 1 trained observer (The Observer Version 5.0.25; Noldus Information Technology). The observer was trained to the ethogram (Table 1) prior to data collection. A total of 18 (6/treatment), 5-minute video clips were selected using the Excel random number generator software. The trainer and the student scored the same video clips until 90% inter-reliability was achieved.
| Measure | Description |
|---|---|
| Visits | |
| Frequency | Began each time the individual nursery pig’s head was in the drinker and terminated when the pig’s head moved out of the drinker for ≥ 5 s. |
| Duration | Total time per visit ≥ 5 s at the drinker.† |
| Aggressive interactions | Aggression in the vicinity of the drinker was defined as any fight, bully, head-knock, or chase which occurred in a radius of 0.6 m‡ or less from the edge of the drinker. |
| Frequency | Frequency of aggressive interactions were calculated as totals for the 6-hour observation period of each day and for each hour of each day. |
| Duration | The duration (seconds) of aggressive interactions were calculated as totals for the 6-hour observation period of each day and for each hour of each day. |
| Drinker location preference | Location preference for the drinker was defined as the duration (seconds) spent in the drinker vicinity (0.6 m or less from the edge of the drinker‡). Drinker location preference was determined for treatment 2 and 3 separately. |
* Behavior was recorded between 7:00 am and 12:59 pm over the 2 consecutive trial days at 1 frame/s.
† Turner et al17 used alternate 5-hour blocks over 24 hours to analyze growing pig drinking behavior. This work defined drinking behavior as when a pig has its head in the drinker for ≥ 5 seconds.
‡ The 0.6 m was rationalized as an average two-third lengths of a 7-week-old nursery pig (beginning at the snout). The drinker proximity was measured using the ruler tool in Adobe Photoshop CS5 (Adobe Systems Inc). The ruler tool was calibrated using the ratio of the length and the pixel length of a nursery pen gate divider. A conversion ratio was determined and a semi-circle was drawn out onto a clear transparency sheet taped to the computer screen from the edge of the drinker. Any aggressive interactions that occurred within the semi-circle were considered “aggressive interactions around the water source.”
Water flow rates and disappearance
Water flow rates met industry flow standards (mean 0.47 L/min).5 A water meter (DLJ-hose Bibb; Daniel L. Jerman Co) was installed on each water line to each nursery pen so that water disappearance for each treatment could be recorded. Water disappearance (water consumed and wasted) from all pens was recorded on both trial days for each hour between 7:00 am and 12:59 pm. Water disappearance occurred when a pig depressed the nipple located inside the drinker during a visit, and water was drawn down through the pipe passing through the water meter which then read the amount of water drawn. For behavior observations, only visits ≥ 5 seconds in duration were assessed, as Turner et al17 determined that it is not possible to conclude if water is drawn during shorter visits.
Statistical analysis
The frequency and duration of visits to the drinker and frequency and duration of aggressive interactions around the drinker made by each pig were acquired through Observer and entered into Microsoft Excel Software. Any visit < 5 seconds in duration was not included in the final analysis. The data was sorted by day, pen, pig, and hour. The total frequency visits to the drinker and the total time spent at the drinker for each observed hour were calculated. The total frequency of visits and visit duration on an hourly basis were analyzed by ANOVA for parametric data using the PROC MIXED procedure of SAS (SAS Institute, Inc) with pen as the experimental unit. Treatment (1, 2, and 3), pen (1-9), and pig number (1-25) being discrete variables were considered fixed effects and were included in the model (PROC MIXED, class statement). Day was initially included in the model, but due to being nonsignificant, was removed. The statistical model included the parameter of interest (treatment). Body weight (kg) of gilts at day 42 was used as a linear covariate. Pen nested within both treatment and day was included as a random effect in the model. A value of P < .05 was considered significant. Descriptive results for the water disappearance data were calculated. Total water disappearance was presented by treatment over the 2-day trial.
Results
Frequency and duration of visits to the drinker
Total drinker visit frequencies during the 6-hour observation period were different between treatments. Pigs in treatment 1 and 2 made fewer total visits compared to treatment 3 (P = .02; Table 2). Pigs assigned to treatment 3 visited the drinker more times when compared to pigs from treatment 2 during the first hour from 7:00 am to 7:59 am (P = .03). Between 8:00 am to 8:59 am and 12:00 pm to 12:59 pm, treatment 3 pigs visited the drinkers more than pigs from the other 2 treatments (P = .01). For all other hours there were no treatment differences in the frequency of visits to the drinkers (P > .05; Table 2). Total drinker visits during the 6-hour observation period differed between treatments (P = .02; Table 3) with treatment 3 pigs spending a greater amount of time at the drinkers when compared to pigs assigned to the other 2 treatments. Pigs in treatment 2 spent more time at the drinker than pigs in treatment 1. Drinker visit duration differed between 8:00 am to 8:59 am, where pigs assigned to treatment 1 spent less time at the drinkers when compared to pigs assigned to treatment 3 (P = .05). Between 12:00 pm and 12:59 pm, treatment 1 pigs spent less time per visit at the drinker compared to pigs assigned to the other 2 treatments (P = .02). For all other hours, there were no treatment differences for the duration of a visit at the drinkers (P > .05; Table 3).
| Treatment† | |||||
| Hour | 1 | 2 | 3 | SE | P‡ |
| 7:00 – 7:59 am | 1.2ab | 0.9a | 1.3b | 0.1 | .03 |
| 8:00 – 8:59 am | 2.3a | 2.6a | 3.7b | 0.3 | .01 |
| 9:00 – 9:59 am | 1.6 | 1.8 | 2.1 | 0.4 | .60 |
| 10:00 – 10:59 am | 1.2 | 1.0 | 1.1 | 0.3 | .66 |
| 11:00 – 11:59 am | 1.9 | 1.9 | 2.5 | 0.2 | .08 |
| 12:00 – 12:59 pm | 2.2a | 2.4a | 3.2b | 0.2 | .01 |
| Total frequency of visits | 10.4a | 10.6a | 13.9b | 0.8 | .02 |
* Trial conducted in November 2006 using 9 pens of 25 gilts/pen for each treatment (3 pens/treatment; n = 225 pigs) in a complete random design. Each pen contained 1, 2, or 3 stainless steel nipple cup drinkers (12.7 cm deep × 28.6 cm high × 17.8 cm wide; Farmweld DRIK-O-MAT Wean-to-Finish Cup; Farmweld, Inc).
† Treatment 1 was defined as 1 drinker/pen (1:25 drinker to pig ratio) and the drinker was positioned on the same side as the feeder and close to the back gate. Treatment 2 was defined as 2 drinkers/pen (1:12 drinker to pig ratio), and the drinkers were positioned as close to the back gate opposite the feeder and same side as the feeder. Treatment 3 was defined as 3 drinkers/pen (1:8 drinker to pig ratio). Drinker positions were close to the back gate same side as the feeder, opposite the feeder, and the third drinker was positioned across from the feeder next to the alleyway gate.
‡ ANOVA; pen nested within both treatment and day was included as a random effect in the model with body weight (kg) used as a linear covariate.
a,b Different superscripts within an hour indicate significant differences (P < .05).
| Treatment*, s | |||||
| Hour | 1 | 2 | 3 | SE | P† |
| 7:00 – 7:59 am | 16.7 | 11.3 | 15.7 | 1.8 | .11 |
| 8:00 – 8:59 am | 29.6a | 35.5ab | 46.7b | 4.3 | .05 |
| 9:00 – 9:59 am | 17.2 | 25.2 | 29.1 | 5.7 | .38 |
| 10:00 – 10:59 am | 15.8 | 12.5 | 14.2 | 2.3 | .62 |
| 11:00 – 11:59 am | 22.5 | 27.4 | 31.7 | 3.8 | .28 |
| 12:00 – 12:59 pm | 23.5a | 35.4b | 41.0b | 3.6 | .02 |
| Total duration of time | 125.3a | 147.3b | 178.4c | 16.3 | .02 |
* Trial design and treatments described in Table 2.
† ANOVA; pen nested within both treatment and day was included as a random effect in the model with body weight (kg) used as a linear covariate.
a,b,c Different superscripts within an hour indicate significant differences (P < .05).
Frequency and duration of aggressive interactions around the drinker
Total aggressive interaction frequencies in the drinker vicinity were not different between treatments (P = .28; Table 4). When comparing the frequency of aggressive interactions hourly across treatments, more aggressive interactions occurred around the drinker within treatment 1 compared to the other treatments between 7:00 am to 7:59 am (P = .02). However, for all other hours, aggressive interactions in the drinker vicinity did not differ (P > .05; Table 4). Total duration of time engaged in aggressive interactions around the drinker were not different between treatments (P = .80; Table 5). When comparing aggressive interaction duration hourly across treatments, pigs assigned to treatment 1 spent more time engaged in aggressive interactions in the drinker vicinity compared to the other treatments between 7:00 am to 7:59 am (P = .02). For the other time periods, there were no differences in aggressive interactions duration around the drinker (P > .05; Table 5).
| Treatment* | |||||
| Hour | 1 | 2 | 3 | SE | P† |
| 7:00 – 7:59 am | 0.18a | 0.08b | 0.04b | 0.03 | .02 |
| 8:00 – 8:59 am | 0.65 | 0.49 | 0.77 | 0.17 | .49 |
| 9:00 – 9:59 am | 0.26 | 0.26 | 0.34 | 0.08 | .74 |
| 10:00 – 10:59 am | 0.29 | 0.08 | 0.16 | 0.06 | .12 |
| 11:00 – 11:59 am | 0.26 | 0.30 | 0.41 | 0.07 | .38 |
| 12:00 – 12:59 pm | 0.40 | 0.40 | 0.66 | 0.12 | .18 |
| Total aggressive interactions | 2.04 | 1.61 | 2.38 | 0.30 | .28 |
* Trial design and treatments described in Table 2.
† ANOVA; pen nested within both treatment and day was included as a random effect in the model with body weight (kg) used as a linear covariate.
a,b Different superscripts within an hour indicate significant differences (P < .05).
| Treatment*, s | |||||
| Hour | 1 | 2 | 3 | SE | P† |
| 7:00 – 7:59 am | 1.22a | 0.49b | 0.16b | 0.22 | .02 |
| 8:00 – 8:59 am | 5.74 | 3.65 | 5.56 | 1.89 | .69 |
| 9:00 – 9:59 am | 2.48 | 2.38 | 1.91 | 0.74 | .84 |
| 10:00 – 10:59 am | 2.17 | 0.76 | 1.21 | 0.52 | .21 |
| 11:00 – 11:59 am | 0.60 | 2.63 | 2.94 | 0.68 | .07 |
| 12:00 – 12:59 pm | 2.57 | 3.29 | 4.37 | 1.23 | .61 |
| Total duration of time | 14.78 | 13.20 | 16.15 | 3.23 | .80 |
* Trial design and treatments described in Table 2.
† ANOVA; pen nested within both treatment and day was included as a random effect in the model with body weight (kg) used as a linear covariate.
a,b Different superscripts within an hour indicate significant differences (P < .05).
Drinker location preference
Total duration of time nursery pigs spent at a specific drinker for treatment 2 were not different (144.7 [16.3] seconds at F vs 158.2 [18.3] seconds at O; P = .47). When comparing the duration of time spent at the drinkers during specific hours across locations for treatment 2, there were no differences between F and O (P > .05). For pigs in treatment 3, there was a difference between all locations in the total time spent with more time spent at O than the other 2 drinker locations (135.9 [16.2] seconds at F vs 188.3 [16.4] seconds at O vs 61.4 [18.1] seconds at A; P < .001). When comparing the duration of time spent at the drinkers hourly, pigs preferred O over A (P < .05), but this preference was not observed during the last hour (P > .05; Figure 2).

Water disappearance
Cumulative water disappearance for the 12-hour observation period was 512.7 L (treatment 1), 356.9 L (treatment 2), and 482.1 L (treatment 3). When evaluating water disappearance based on location, water only disappeared from F for treatment 1 as expected because treatment 1 pigs only had access to this 1 drinker. In treatment 2 and 3 when pigs were given a choice, more water disappeared from the drinker positioned opposite the feeder close to the back gate (O). Similar amounts of water disappeared from F and A locations in treatment 3 (Figure 3).

Discussion
Healthy pigs kept at thermal-neutral conditions display a distinct drinking pattern over a 24-hour period. Pigs begin drinking between 5:00 am to 6:00 am, with a peak in water disappearance around 1:00 pm followed by a gradual decline at 4:00 pm, and drinking leveled off around 10:00 pm.21 Drinking is an ingestive, cyclic, and sequential behavior event that is often performed with feeding.22 It can be difficult to precisely ascertain if a pig is drinking, or just in the drinker vicinity. Turner et al17 used alternate 5-hour blocks over 24 hours to analyze growing pig drinking behavior using video recording. This work defined drinking behavior as when a pig has its head in the drinker for ≥ 5 seconds. Based on these previous bodies of work, drinking patterns and water disappearance in the current study were recorded over the morning to early afternoon hours using video recording, and only considered a drinking event as being ≥ 5 seconds. Pig drinker accessibility was also considered when deciding upon drinker location within the nursery pen. Previous work has suggested that drinkers placed too close to each other, a wall, or too close to the feeder can cause 1 or more pigs to dominate the drinker. Spacing between waterers when using > 1 waterer/pen has been suggested at 31 cm and located in an area free of incoming air to prevent freezing of pipes.1
The results of this study, although important, need to be interpreted within context by producers and veterinarians. Water intake can be influenced by drinker design,11,12 diet,13,14 environmental conditions,15 health status,16 social competition,17 drinker maintenance, and location.2 Weanling pigs consume approximately 20 kg of water per 100 kg of body weight daily, while those near market weight consume much less, approximately 7 kg of water per 100 kg of body weight daily.23 These differences are due to younger pigs having proportionally greater pulmonary and peripheral losses.24 To meet these increased water needs, younger pigs engage in more drinking related activities over 24 hours.25
In a review by Weary et al,26 the link between behavior and illness is discussed. The authors note that abnormal drinking behavior, decreased activity, and isolation behaviors are indicative of general malaise. To compliment these behavioral changes, pigs will also display key clinical signs of inadequate water consumption, such as dry feces, hollow eyes, and dehydrated skin. Therefore, understanding drinking patterns (defined as water disappearance, water consumption, and water wastage) and combining this with behavioral measures and clinical signs (frequency visits, visit duration, and water intake per unit of time10) are useful to help pork producers and swine veterinarians predict potential or actual health issues.27 Brumm21 reported that if daily water usage drops more than 30% or if water usage is severely decreased for 3 continuous days, this provides evidence of an occurring health challenge. Producers and veterinarians need to understand nursery pig drinking patterns and water availability if administering a water-based pharmaceutical product, electrolyte supply, acidifiers, or probiotics in conjunction with antibiotics to maximize health.28,29
Exogenous environmental factors can also influence drinking. The recommended thermal conditions for a US nursery pig are between 18.3 and 32.2°C.19 Brumm21 noted that the daily drinking needs in warm conditions for pigs range between 1.89 L/pig/day for newly weaned piglets to greater than 5.68 L/pig/day for grow-finish pigs using nipple waterers. Several different types of drinkers are used in the United States, such as cup waterers, bite drinkers, nipple drinkers, nose drinkers, troughs, and wet feed systems.30 Brumm31 reported that wet/dry feeders and bowl drinkers had lower water to feed ratios (2.11:1 kg of water per kg of feed disappearance) when compared to gate-mounted nipple drinkers which had higher water to feed ratios (3.35:1 kg of water per kg of feed disappearance) in nursery pigs. Regardless of drinker type implemented on-farm, producers and veterinarians must ensure that it is suitable for the pigs’ age and size, that it can provide water at an appropriate flow rate and pressure, and that it is positioned correctly.32 Finally, group size and space has been shown to affect pig drinking behavior. Turner et al17 compared 20 versus 60 pigs at 0.51 m2 and reported that although water usage was higher when pigs were housed in larger groups, total drinking time per pig decreased.
In this study, healthy nursery pigs kept at thermal-neutral conditions and provided a nipple cup waterer were compared. Offering 3 drinking resources resulted in pigs visiting the drinkers 4 times more and for longer (53 seconds longer than 1 drinker, or 31 seconds longer than 2 drinkers) over the studied hours. Our results are slightly lower than work published by Andersen et al10 who reported that barrows visited the nipple drinker 21 times between 6:00 am and 2:00 pm and spent 274 seconds drinking. However, differences could be attributed to the different drinker systems (stainless steel nipple cup drinker versus nipple), group sizes (25 pigs/pen versus 3 or 10, respectively), sex (gilts versus barrows), age (7 weeks versus 8-9 weeks), average water flow rate (0.47 L/min versus 0.82 L/min) and the additional hour that was observed.
When breaking down visits, duration, and water disappearance by drinker location, nursery pigs preferred the drinker location opposite the feeder, followed by the feeder location. These findings agree with Turner et al17 who compared 4 treatments that varied both pig and drinker number. The authors concluded that a 1:10 drinker to pig ratio resulted in more visits than a 1:20 drinker to pig ratio. Although feeder visits and feeding behavior were not collected in the current work, it has been documented that there is a clear relationship between feeding and drinking33 along with preferred times when pigs will drink.21,34 Haugse et al35 found that 35% of pigs would begin drinking immediately after they were finished eating, and pigs engaged in drinking behavior would subsequently initiate feeding 50% of the time. Thus, this drinker location opposite the feeder along the back gate may have given pigs more space to move away from other pigs that were trying to get to or were already at the feeder.
When considering the study length of 12 hours and breaking water disappearance down onto a per pig level, treatment 1 pigs used 6.84 L/pig/12 hours, treatment 2 used 4.76 L/pig/12 hours, and treatment 3 used 6.43 L/pig/12 hours. Water disappearance in this study for nursery pigs given 1 water source was higher than reported by Andersen et al.10 In that study the researchers monitored growing barrows over 24 hours that had access to 1 water nipple/pen and reported overall water disappearance at 4.99 L/pig/24 hours. We cannot conclude that increased drinker time equates to higher water consumption as the consumed versus waste was not recorded. The researchers anecdotally noted that the alley was used as the preferred dunging area. Dunging is typically done away from feed and water resources. In the case of placing 3 waterers, we may have limited the nursery pig’s ability to dung away from 1 of the waterers. Therefore, if producers or veterinarians were considering increasing water access, then it would be advisable for placement decisions to be based on avoiding areas where pigs traditionally dung.
Finally, aggression over all treatments was low in frequency and short in duration. These low aggression levels could be attributed to several factors, such as pigs had adequate space between waterers, pigs had an established hierarchy, and barn personnel inspected waterers daily for correct height and working abilities. Therefore, in conclusion, determining where to place drinkers and the number of drinkers per pen may improve a nursery pig’s ability to access a drinker.
Implications
Under the conditions of this study:
• Providing 3 drinkers increased visits and time spent at the drinker.
• Pigs exhibited a location preference for a drinker opposite the feeder.
Acknowledgments
This work was supported by Boehringer Ingelheim, Iowa Farm Bureau Federation, and start-up funds from Iowa State University Department of Animal Science.
Conflict of interest
Dr Holck and Mr Edler worked for Boehringer Ingelheim and the company partially funded this project. The roles of Dr Holck and Mr Edler were in experimental design and final manuscript approval. These co-authors were not involved in data collection, data analysis, or interpretation of the study findings.
Disclaimer
Scientific manuscripts published in the Journal of Swine Health and Production are peer reviewed. However, information on medications, feed, and management techniques may be specific to the research or commercial situation presented in the manuscript. It is the responsibility of the reader to use information responsibly and in accordance with the rules and regulations governing research or the practice of veterinary medicine in their country or region.
References
1. McGlone J, Pond WG. Pig Production: Biological Principles and Applications. Clifton Park, NY: Thomson, Delmar Learning; 2003.
2. Azarpajouh S, Garcia A, Jackson C, Karriker L, Ramirez A, Johnson A. The importance of water in pig production. CAB Reviews. 2018;13:1-17. doi:10.1079/PAVSNNR201813048
3. National Research Council. Nutrient Requirements of Swine: Eleventh Revised Edition. Washington, DC: The National Academies Press; 2012. doi:10.17226/13298
*4. Menegat MB, Goodband RD, De-Rouchey JM, Tokach MD, Woodworth JC, Dritz SS. Kansas State University Swine Nutrition Guide: Water in swine nutrition. https://www.asi.k-state.edu/research-and-extension/swine/swinenutritionguide/pdf/KSU%20Water%20in%20Swine%20Nutrition%20fact%20sheet.pdf. Published 2019. Accessed July 30, 2020.
*5. National Pork Board. Pork Quality Assurance Plus™ Version 4.0 Education Handbook (PQA Plus™). http://www.porkcdn.com/sites/all/files/documents/PQAPlus/V4.0/Forms/PQAv4e_Handbook.pdf. Published 2019. Accessed December 5, 2019.
*6. White M. Salt poisoning and water deprivation. The Pig Site. https://www.thepigsite.com/articles/2315/salt-poisoning-and-waterdeprivation. Published 2008. Accessed September 4, 2019.
7. Maynard LA, Loosli JK, Hintz HF, Warner RG. Animal Nutrition. 7th ed. Blacklick, OH: McGraw-Hill College; 1979.
8. Hurnik JF, Webster AB, Siegel PB. Dictionary of Farm Animal Behavior. 2nd ed. Ames, IA: Iowa State University Press; 1995.
9. Dybkjaer L, Jacobsen AP, Togersen FA, Poulsen HD. Eating and drinking activity of newly weaned piglets: effects of individual characteristics, social mixing, and addition of extra zinc to the feed. J Anim Sci. 2006;84(3):702-711. doi:10.2527/2006.843702x
10. Andersen H, Dybkjaer L, Herskin M. Growing pigs’ drinking behaviour: Number of visits, duration, water intake and diurnal variation. Animal. 2014;8(11):1881-1888. doi:10.1017/S175173111400192X
11. Brumm MC, Dahlquist JM, Heemstra JM. Impact of feeders and drinker devices on pig performance, water use, and manure volume. J Swine Health Prod. 2000;8(2):51-57.
12. Torrey S, Widowski TM. A note on piglets’ preferences from drinker types at two weaning ages. Appl Anim Behav Sci. 2006;100:333-341. doi:10.1016/j.applanim.2005.12.007
13. Shaw MI, Beaulieu AD, Patience JF. Effect of diet composition on water consumption in growing pigs. J Anim Sci. 2006;84(11):3123-3132. doi:10.2527/jas.2005-690
14. Vermeer HM, Kuijken N, Spoolder HAM. Motivation for additional water use of growing-finishing pigs. Livest Sci. 2009;124:112-118. doi:10.1016/j.livsci.2009.01.009
15. Huynh TT, Aarnink AJ, Verstegen MW, Gerrits WJ, Heetkamp MJ, Kemp B, Canh TT. Effects of increasing temperatures on physiological changes in pigs at different relative humidities. J Anim Sci. 2005;83(6):1385-1396. doi:10.2527/2005.8361385x
16. Madsen TN, Kristensen AR. A model for monitoring the condition of young pigs by their drinking behavior. Comput Electron Agric. 2005;48(2):138-154. doi:10.1016/j.compag.2005.02.014
17. Turner SP, Edwards SA, Bland VC. The influence of drinker allocation and group size on the drinking behaviour, welfare and production of growing pigs. J Anim Sci. 1999;68:617-624.
*18. PIC. Wean to Finish Manual. https://ro.pic.com/wp-content/uploads/sites/18/2019/01/Wean-To-Finish-Manual.pdf. Published 2014. Accessed September 11, 2019.
*19. National Pork Board. Swine Care Handbook. http://porkcdn.s3.amazonaws.com/sites/all/files/documents/PorkStore/04010.pdf. Published 2018. Accessed February 3, 2020.
20. National Research Council. Nutrient Requirements of Swine. 10th ed. Washington, DC; National Academy Press; 1998.
*21. Brumm M. Patterns of drinking water use in pork production facilities. https://digitalcommons.unl.edu/coopext_swine/221/. Published 2006. Accessed August 30, 2019.
22. McGlone JJ. Techniques for evaluation and quantification of pig reproductive, ingestive, and social behaviors. J Anim Sci. 1991;69(10):4146-4154. doi:10.2527/1991.69104146x
23. National Research Council. Effect of Environment on Nutrient Requirements of Domestic Animals. Washington, DC: The National Academies Press; 1981. doi:10.17226/4963
24. Whittemore C. The Science and Practice of Pig Production. Oxford, UK: Blackwell Science Ltd; 1993.
25. Worobec EK, Duncan IJH, Widow-ski TM. The effects of weaning at 7, 14 and 28 days on pig behavior. Appl Anim Behav Sci. 1999;62:173-182. doi:10.1016/S0168-1591(98)00225-1
26. Weary DM, Jasper J, Hötzel MJ. Understanding weaning distress. Appl Anim Behav Sci. 2008;110:24-41. doi:10.1016/j.applanim.2007.03.025
*27. Pedersen BK, Madsen TN. Monitoring water intake in pigs: Prediction of disease and stressors. Proc Livestock Environment VI: Proceedings of the 6th International Livestock Environment Symposium. Louisville, KY. 2001:173-179.
*28. Edler RA, Holck JT, Lawrence BV, Baker RG, Johnson AK. Drinking behavior or nursery pigs for oral vaccine administration. Proc Allen D. Leman Swine Conference. St. Paul, MN. 2006:38.
*29. Taylor G, Roese G, Brewster C. Water medication for pigs. http://www.thepigsite.com/articles/1/health-and-welfare/1623/watermedication-for-pigs. Published 2006. Accessed July 30, 2020.
30. Gill BP, Barber J. Water delivery systems for growing pigs. Farm Build Prog. 1990;102:19-22.
31. Brumm MC. Water systems for swine. http://porkgateway.org/resource/water-systems-for-swine-2/. PIG 07-02-01. Published 2006. Accessed July 30, 2020.
32. Li YZ, Chénard L, Lemay SP, Gon-you HW. Water intake and wastage at nipple drinkers by growing-finishing pigs. J Anim Sci. 2005;83(6):1413-1422. doi:10.2527/2005.8361413x
33. Yang TS, Howard B, McFarlane WV. Effects of food on drinking behaviour of growing pigs. Appl Anim Ethol. 1981;7:259-270. doi:10.1016/0304-3762(81)90082-1
34. Rossi R, Del Prete E, Rokitzky J, Scharrer E. Circadian drinking during ad libitum and restricted feeding in pygmy goats. Appl Anim Behav Sci. 1999;61(3):253-261. doi:10.1016/S0168-1591(98)00191-9
35. Haugse CN, Dinusson WE, Erickson DO, Johnson JN, Buchanan ML. A day in the life of a pig. N Dakota Farm Res. 1965;23(12):18-23.
*Non-refereed references.
 PDF version
 RIS
citation
RIS
citation