| Original research | Peer reviewed |
Cite as: Wu F, Liao J, Tokach MD, et al. A retrospective analysis of seasonal growth patterns of nursery and finishing pigs in commercial production. J Swine Health Prod. 2019;27(1):19-33. https://doi.org/10.54846/jshap/1112
Also available as a PDF.
SummaryObjective: Determine seasonal patterns of nursery and finisher growth performance in 3 commercial US production systems located in the midwest. Materials and methods: Five years of production records, including 5039 nursery and 5354 finisher production batches, were collected from 3 production systems. Explanatory variables include system, site, pig-flow type, feeder type, batch size, week of placement, average days-on-feed, fill length, number of sow farm sources, dietary energy, mortality, and initial body weight. Week of placement served as the unit for seasonal patterns. Nursery and finisher performance (average daily gain [ADG], average daily feed intake [ADFI], and gain to feed ratio [G:F]) were analyzed in separate datasets using multi-level linear mixed models. A guided stepwise selection approach was used to select fixed variables and their interactions. Seasonality curves were generated using rolling averages of least squares means with a 5-week window and 1-week step-size. Results: For nursery, the seasonality effect was significant (P < .001) for ADG, ADFI, but not for G:F. Nursery ADG and ADFI decreased as week of placement progressed from the 1st to 20th week of a year but increased thereafter. All finisher growth responses were affected by week of placement (P < .001) but the pattern and magnitude of seasonal variability differed among systems (system × week interactions, P < .02). Implications: Seasonal variability of nursery and finisher performance can be quantified using production records in a multi-level linear mixed model. Seasonality effects on finisher performance were system dependent, while nursery seasonality shared more similarity among investigated systems. | Resumen
| ResuméObjectif: Déterminer les patrons saisonniers des performances de croissance de porcs en pouponnière et en finition dans trois systèmes de production commerciale américains situés dans le midwest. Matériels et méthodes: Les relevés de production d’une période de 5 ans, incluant 5039 et 5354 lots de production de porcs en pouponnière et en finition, respectivement, ont été prises de trois systèmes de production. Les variables descriptives incluaient le système, le site, le type de flux des porcs, le type de mangeoire, la taille du lot, la semaine de placement, la moyenne de jours nourris, le temps de peuplement, le nombre de ferme d’origine des truies, l’énergie alimentaire, le taux de mortalité, et le poids corporel initial. La semaine de placement a servi d’unité pour les patrons saisonniers. Les performances en pouponnière et en finition (gain moyen quotidien [ADG], consommation alimentaire moyenne quotidienne [ADFI], et ratio gain sur nourriture [G:N]) ont été analysées dans bases de données séparées en utilisant des modèles linéaires mixtes à niveaux multiples. Une approche de sélection progressive guidée a été utilisée pour sélectionner les variables fixes et leurs interactions. Les courbes saisonnières ont été générées en utilisant les moyennes de roulement des moyennes des moindres carrés avec une fenêtre de 5 semaines et une progression de 1 semaine. Résultats: Pour la pouponnière, l’effet saisonnier était significatif (P < .001) pour le ADG et la ADFI, mais pas pour le G:N. En pouponnière, le ADG et la ADFI ont diminué à mesure que les semaines de placement progressaient de la semaine 1 à la semaine 20 d’une année mais ont augmenté par la suite. En finition, toutes les réponses de croissance étaient affectées par la semaine de placement (P < .001) mais le patron et la magnitude de variation saisonnière différaient parmi les systèmes (système × interactions semaine, P < .02). Implications: La variabilité saisonnière des performances en pouponnière et en croissance peut être quantifié en utilisant les données de production dans un modèle linéaire mixte à niveaux multiples. Les effets saisonniers sur les performances en finition étaient dépendants du système, alors que les effets saisonniers en pouponnière partageaient plus de similarité parmi les systèmes étudiés. |
Keywords: swine, seasonality, growth performance, nursery, finisher
Search the AASV web site
for pages with similar keywords.
Received: July 14, 2018
Accepted: September 5, 2018
It is widely documented that pig production has seasonal variations.1-3 Pigs have a limited ability to thermoregulate, thus extreme temperatures result in increased reproductive difficulties, reduced growth performance, and elevated mortality.1 Seasonal heat stress loss estimates indicate a nearly $300 million annual cost to the US swine industry.4
An accurate estimate of seasonal variability in feed consumption and growth rate is essential for commercial producers to estimate feed usage and marketing projections. Coarse estimations of the seasonality curve are sometimes generated based on raw means of weekly production performance. However, the precision of this method may be questioned as it does not account for factors confounded with seasonality. For instance, some nutritional programs feed pigs with increased dietary energy during the summer to counteract the decreased feed intake. Additionally, pigs grow slower and, therefore, producers likely extend their feeding period and change their marketing strategy in the summer compared with other times of the year. These confounding factors along with other production variables, such as different pig flows, feeder types, ventilation designs, and stocking densities, are also known to cause variations in growth and, therefore, need to be accounted for in a seasonality analysis. In a retrospective study conducted in 1995 by Bahnson and Dial,3 seasonal patterns of finisher average daily gain (ADG) and average daily feed intake (ADFI) in commercial swine production were determined using multiple linear regression models. However, the inference scope of this study is limited to a single production system and such seasonal patterns require validation and an update using current data from modern production systems.
The objective of this study was to develop a systematic modeling approach to estimate the seasonality effects (expressed as the week of placement in a year) on growth performance of nursery and finishing pigs using retrospective commercial production records.
Material and methods
Data collection
Five years of production records from January 2013 to December 2017 were collected from three swine production systems located in the midwestern United States. A total of 5039 nursery and 5354 finisher production batches representing nearly 28 million market pigs were included in the raw dataset. The dataset structure consists of three levels: system, site, and batch. The batch was defined as a cohort of pigs per airspace within a site. In most cases the airspace was defined at the barn level. Some sites consisted of multiple barns, of which production records were reported as separate batches; however, the size of sites (eg, number of barns per site or rooms per batch) was not available for analysis. There were 25, 49, and 126 nursery sites; 513, 142, and 126 finisher sites; and 398, 52, and 130 wean-to-finish sites in systems A, B, and C, respectively. Explanatory variables collected at the site level were types of pig flow and feeder design. Nursery flow types included conventional nursery (nursery), nursery phase of wean-to-finish flow (WF-nursery), and wean-to-finish facilities that only housed nursery flows (converted-nursery). Finisher flow types included conventional finishing (finishing) and finishing phase of wean-to-finish flow (WF-finishing). At the batch level, data collected included starting and ending inventory, start date, close date, average days on feed (DOF), length of fill period, number of sow farm sources (sowfarm), average dietary net energy (NE), mortality, initial body weight (BW), final BW, ADG, ADFI, and gain to feed ratio (G:F). The final BW of WF-nursery batches and the initial BW of WF-finishing batches were determined based on pigs that were loaded onto trucks, weighed, and transferred from the wean-to-finish barn to another finisher; it is assumed that the batch of pigs that stayed in the wean-to-finish barn had similar average BW as those that were transferred out. Start date and close date referred to the first and last day, respectively, that pigs of the batch were in the facility. Average DOF was calculated as the sum of pig days (defined as one live pig being fed for one day) divided by the total number of pigs started. Average dietary NE was calculated based on major ingredient usage per batch and estimated energy density of ingredients.
Data processing
The raw dataset was divided into two subsets for separate analysis of nursery and finisher performance. Because dietary NE data was only available since 2015 in system A, the finisher dataset analysis was limited to 3 years (2015 to 2017) of observations to avoid confounded effects between system and year. However, given that the nutritional programs of the three systems did not alter energy content of nursery diets over seasons, NE was not considered in the nursery models so that the nursery dataset could include 5 years of data and provide an increased number of replications for seasonality analysis.
Initial diagnosis was performed using scatter plots for each explanatory and outcome variable to identify outliers. Screening criteria and the number of observations removed are presented in Table 1. For the nursery dataset, observations with suspected errors in BW estimation (ie, ADG < 0), recorded feed usage (ie, G:F > 1000 g/kg), or date recording (ie, fill length > DOF) as well as inaccurate pig counts (ie, mortality < 0) were removed from the dataset. Additionally, observations were removed if DOF < 21 d or final BW > 50 kg because they did not represent the standard pig flow among the systems. For the finisher dataset, observations with suspected errors in recorded feed usage (ie, ADFI > 4 kg, ADFI < 1.5 kg, or G:F > 1000 g/kg) were removed. Finisher observations with initial BW < 10 kg or > 70 kg, or final BW < 100 kg or > 150 kg, were considered non-normal production flows and were removed from the dataset. Feed delivery recording errors were identified when feed allocation was inaccurately recorded between consecutive batches resulting in abnormal G:F variability (eg, G:F < 300 g/kg in a batch and G:F > 1000 g/kg in the subsequent batch due to carry over or misallocation of feed among batches or when there was an extreme high and extreme low value among batches within a site). The ADFI and G:F values of these observations were deleted, but ADG values were unchanged.
Table 1: Screening criteria for exclusion of nursery and finisher batches from three swine production systems located in the midwestern United States from January 2013 to December 2017
| Production system | |||
|---|---|---|---|
| Item | A | B | C |
| Nursery dataset | |||
| Production batches in the raw dataset, No. | 2632 | 1125 | 1282 |
| Observation removal, No. | |||
| Inaccurate pig counts* | 1 | 1 | 9 |
| Average DOF < 21 d | 14 | 2 | 0 |
| Final BW > 50 kg | 26 | 0 | 2 |
| Suspected BW estimation errors (ie, biologically abnormal ADG) | 7 | 2 | 0 |
| Suspected feed accounting errors (ie, G:F > 1000 g/kg) | 11 | 1 | 0 |
| Suspected date recording errors (ie, fill length > DOF) | 1 | 2 | 0 |
| Production batches in the final dataset, No. | 2572 | 1117 | 1271 |
| Value removal, No. | |||
| Feed delivery recording errors†| 45 | 0 | 4 |
| Removal rate, % | 4.0 | 0.7 | 1.2 |
| Finisher dataset | |||
| Production batches in the raw dataset, No. | 2862 | 1076 | 1416 |
| Observation removal, No. | |||
| Unusual pig flow‡ | 2 | 0 | 1 |
| Initial BW < 10 kg | 9 | 1 | 1 |
| Initial BW > 70 kg | 30 | 1 | 0 |
| Final BW < 100 kg | 16 | 6 | 0 |
| Final BW > 150 kg | 1 | 0 | 0 |
| Suspected feed accounting errors§ | 14 | 1 | 2 |
| Production batches in the final dataset, No. | 2790 | 1067 | 1412 |
| Value removal, No. | |||
| Feed delivery recording errors†| 2 | 1 | 0 |
| Suspected dietary energy recording errors¶ | 23 | 0 | 0 |
| Removal rate, % | 3.4 | 0.9 | 0.3 |
* Including batches with abnormal inventory and mortality < 0.
† Feed allocation was inaccurately recorded between consecutive batches resulting in abnormal variability in G:F. Only ADFI and G:F values were removed.
‡ Half of the total inventory was filled 90 days after filling of the first half.
§ Including batches with ADFI > 4 kg, ADFI < 1.5 kg, or G:F > 1000 g/kg.
¶ Only net energy values were removed.
DOF = days on feed; BW = body weight; ADG = average daily gain; G:F = gain to feed ratio; ADFI = average daily feed intake.
For each observation, week of placement (week; calendar year beginning January 1) was designated according to the start date and served as the unit for seasonality effect. Pig inventory counts were categorized to form batch size classes to avoid multicollinearity with fill length because batches with greater inventory often required a longer fill period. Sizes of nursery batches include < 3000, 3000 to 6000, and > 6000, and sizes of finisher batches include < 1500, 1500 to 3500, and > 3500. These inventory categories were selected to represent common commercial facility capacities. However, information regarding space allowance, stocking density, or pen or barn dimension was not available from every production system for analysis. In addition, feeder designs were categorized into 3 types: dry, tube, and wet-dry. Facilities equipped with mixed feeder types were assigned a missing value due to the limited number of observations (n = 137) with mixed types of feeders.
Statistical analysis
Nursery and finisher datasets were analyzed separately. Average daily gain, ADFI, and G:F were evaluated as response variables. System, flow, size, year, feeder type, and week were treated as categorical variables, while fill length, DOF, mortality, sowfarm, and dietary NE were treated as continuous variables. Quadratic terms of DOF and mortality were evaluated for potential non-linear effects on pig growth responses. Dietary NE was only available for finisher models. In the nursery dataset, converted-nursery was exclusive to system A, resulting in confounded effects between system and flow. Thus, the system and flow variables were merged in the nursery dataset to form a 7-category variable termed system-flow.
For each response variable, first-order ordinary least squares regression models, involving predictor variables of system (or system-flow in the nursery dataset), year, week, size, fill length, DOF, initial BW, mortality, NE (only for finisher dataset), and feeder type, were constructed for regression diagnostics following procedures described by Chen et al.5 Observation leverage was estimated and evaluated in a leverage versus residual squared plot to identify influential observations. Suspected observations were assessed for biological accuracy and recorded in the screening list if removed from the dataset (Table 1). Multicollinearity among predictor variables was tested using variance inflation factor (VIF); variables with VIF values greater than 6 were further diagnosed using two-way scatter plots. There was evidence showing multicollinearity between finisher initial BW and DOF due to a strong, negative linear correlation (r = -0.83). Because the alteration of DOF was often considered a part of the seasonality change in finishing pig production (eg, pigs raised during the summer had a longer feeding period than in the winter), initial BW was included in the finisher models instead. However, DOF of nursery batches did not vary significantly over seasons and thus was used in the nursery models. Studentized residuals versus fitted values and studentized residuals versus each categorical descriptive variable plot were examined for heteroscedasticity. Heteroscedasticity was found among systems as observations from system A had consistently greater residual variance compared with systems B and C across all response variables; therefore, a dummy variable (“variance group”; variance group = 1 if system = A, variance group = 0 if system = B or C) was created and accounted for in the analysis.
Multi-level linear mixed models for each response variable were constructed with batch serving as the observational unit, site as a random effect, and system (system-flow in nursery dataset) as a fixed effect. A random residual term of batch within variance group was included in all models to account for heterogeneous variance among systems. A guided stepwise selection approach was employed to select variables and their interaction terms. Specifically, a saturated first- order model was first fit involving all candidate fixed variables. This model was then reduced in a stepwise manner based on variable significance level (P > .10) and improvement in Bayesian information criterion (BIC). Possible two-way interactions among remaining fixed variables were introduced to form a saturated two-way model. The final model was achieved by stepwise removal of interaction terms based on their significance level (P > .10) and improvement in model BIC. Bayesian information criterion was used as an indicator of model suitability.6 Restricted maximum likelihood method was used in the model selection to evaluate the significance of fixed effect terms. The Kenward-Roger’s procedure was used to estimate degrees of freedom and adjust estimated SE for bias correction. Also, at each model selection step, studentized residuals were evaluated. All analyses were performed using Stata Statistical Software (Release 15; StataCorp LLC, College Station, Texas).
Least squares means for week of placement were generated using the margins command with “asbalanced” and “emptycells(reweight)” options.7 To generate a smooth seasonality curve for each growth response, rolling averages of the least squares means were calculated using a centered 5-week window with step-size of 1 week. Rolling averages for weeks 1, 2, 51, and 52 were generated by recursive extension of the week series (eg, rolling average of week 1 represents the mean of weeks 51, 52, 1, 2, and 3). Finally, seasonal patterns were standardized using growth responses in week 1 as a benchmark and that of other weeks were expressed as changes in response relative to week 1.
Results
Descriptive statistics
Explanatory variable frequencies and histograms are presented in Table 2 and Figures 1, 2, and 3. The majority (> 80%) of the nursery batches were filled within 20 days with system A having a longer average fill length than systems B and C. In contrast, the majority of finisher batches were filled within two days. In both nursery and finisher datasets, more than 65% of the production batches sourced pigs from a single sow farm, while about 30% of the batches obtained pigs from 2 to 6 sow farm sources. The number of observations per week of placement varied throughout the year and averaged 95 and 101 batches per week in nursery and finisher datasets, respectively. Descriptive statistics for initial and final BW, DOF, mortality, and growth responses along with US industry benchmarks8 are shown in Table 3. The mean values of initial BW were 5.5 and 27.0 kg, final BW were 26.6 and 125.3 kg, DOF were 55.3 and 112.4 days, and mortalities were 4.1% and 4.0% in nursery and finisher datasets, respectively. The mean values of ADG were 370 and 871 g, ADFI were 630 and 2436 g, and G:F were 602 and 358 g/kg in nursery and finisher, respectively. These growth responses were reasonably in line with average industry levels for the same time period.
Table 2: Frequency of nursery and finisher batches from three swine production systems located in the midwestern United States from January 2013 to December 2017 for each explanatory variable
| Production system | |||
|---|---|---|---|
| Item | A | B | C |
| Nursery dataset | |||
| Year | |||
| 2013 | 574 | 212 | 201 |
| 2014 | 401 | 211 | 235 |
| 2015 | 552 | 226 | 246 |
| 2016 | 562 | 222 | 279 |
| 2017 | 483 | 246 | 310 |
| Type of pig flow | |||
| Converted-nursery* | 601 | 0 | 0 |
| Nursery | 816 | 802 | 619 |
| WF-nursery†| 1155 | 315 | 652 |
| Batch size | |||
| < 3000 pigs | 1198 | 583 | 436 |
| 3000 to 6000 pigs | 396 | 237 | 288 |
| > 6000 pigs | 978 | 297 | 547 |
| Feeder type | |||
| Dry | 543 | 981 | 786 |
| Tube | 718 | 12 | 81 |
| Wet-dry | 965 | 27 | 295 |
| Missing‡ | 346 | 97 | 109 |
| Finisher dataset | |||
| Year | |||
| 2015 | 908 | 343 | 442 |
| 2016 | 986 | 345 | 463 |
| 2017 | 896 | 379 | 507 |
| Type of pig flow | |||
| Finishing | 2084 | 877 | 955 |
| WF-finishing§ | 706 | 190 | 457 |
| Batch size | |||
| < 1500 pigs | 45 | 115 | 143 |
| 1500 to 3500 pigs | 1231 | 540 | 959 |
| > 3500 pigs | 1514 | 412 | 310 |
| Feeder type | |||
| Dry | 95 | 598 | 664 |
| Tube | 634 | 289 | 283 |
| Wet-dry | 1787 | 85 | 378 |
| Missing‡ | 274 | 95 | 87 |
* Wean-to-finish facilities that were used for traditional nursery pig flow.
† Nursery phase of wean-to-finish flow.
‡ Including missing information and facilities with mixed feeder types.
§ Finishing phase of wean-to-finish flow.
WF = wean-to-finish.
Figure 1: Frequency distribution of fill length for (A) nursery and (B) finisher batches from three swine production systems located in the midwestern United States from January 2013 to December 2017.
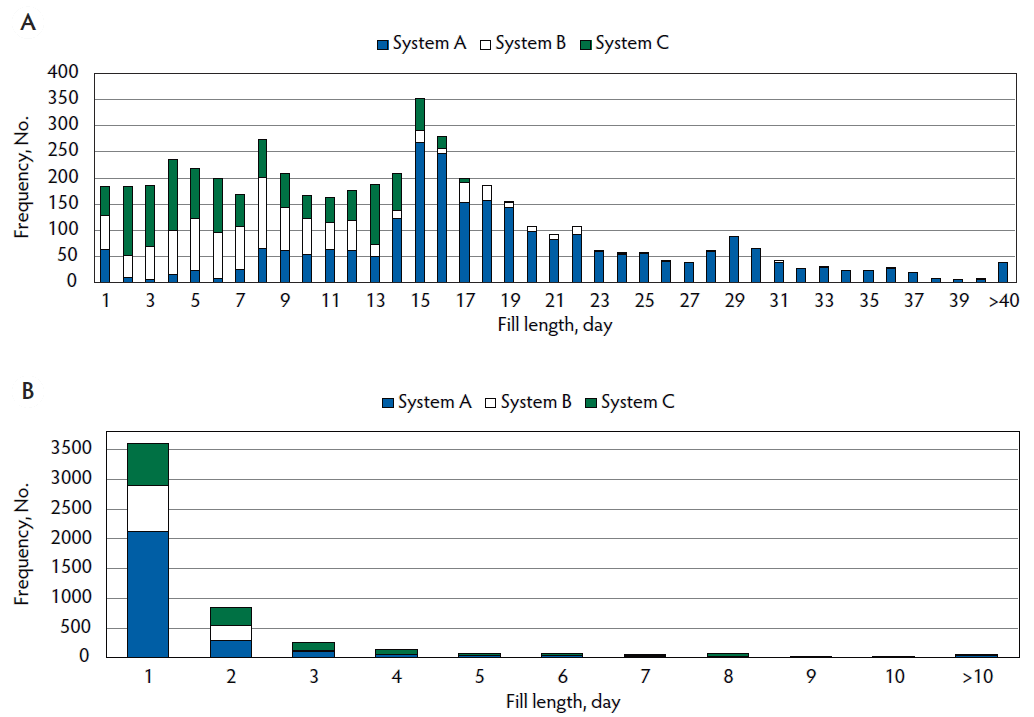
Figure 2: Frequency distribution of number of sow farm sources for (A) nursery and (B) finisher batches from three swine production systems located in the midwestern United States from January 2013 to December 2017.
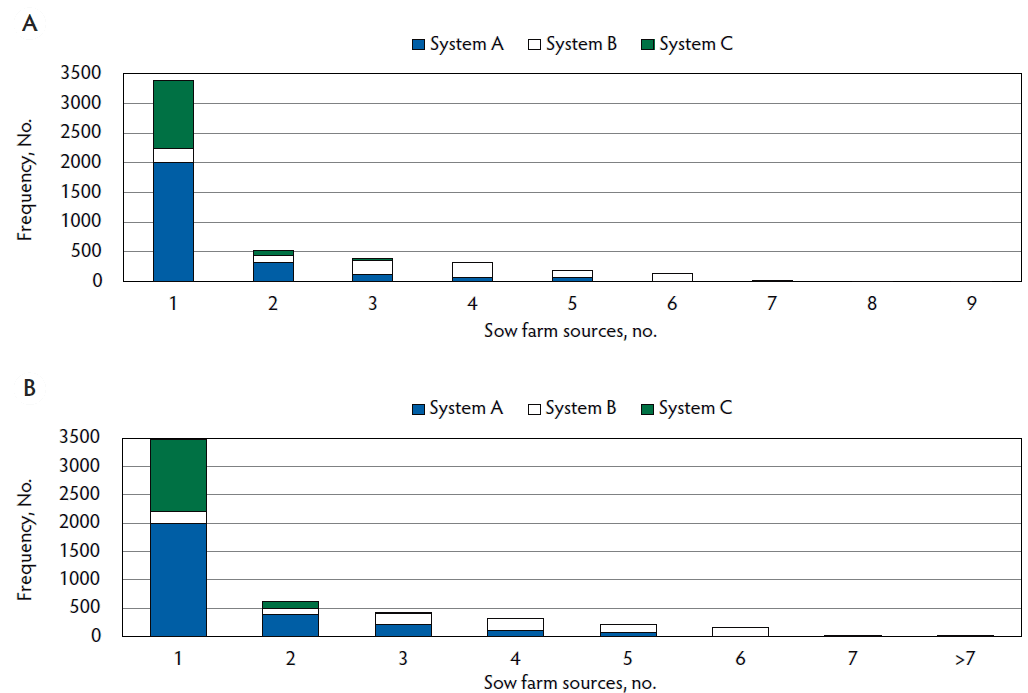
Figure 3: Frequency distribution of week of placement for (A) nursery and (B) finisher batches from three swine production systems located in the midwestern United States from January 2013 to December 2017.
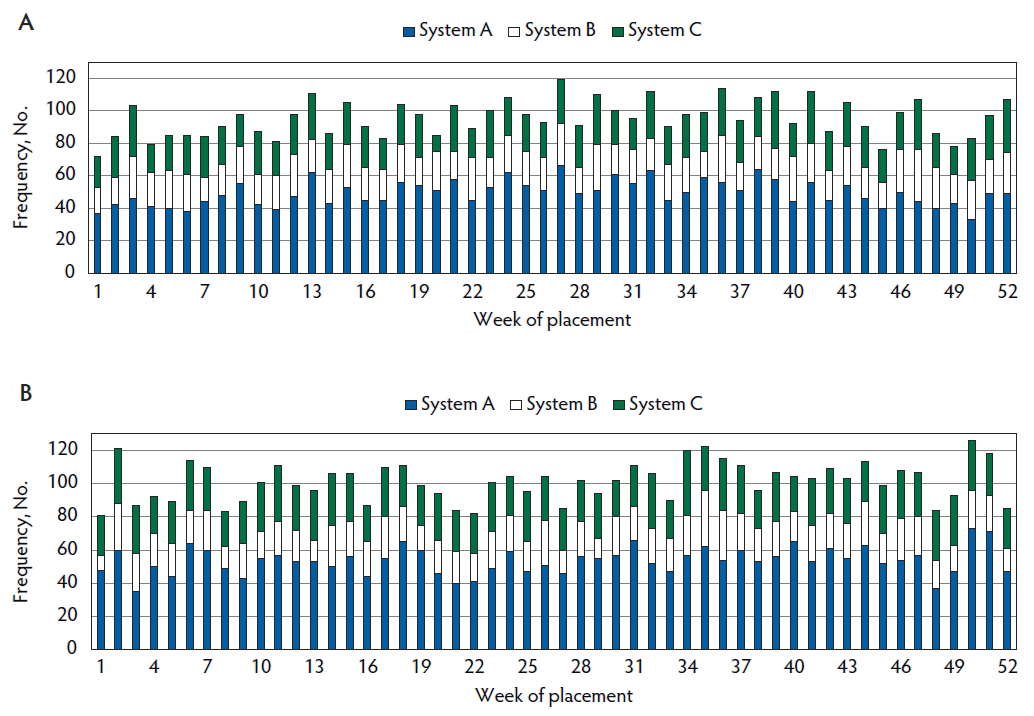
Table 3: Descriptive analysis of explanatory and outcome variables for nursery and finisher batches from three swine production systems located in the midwestern United States from January 2013 to December 2017
| Item | N | Mean (SD) | Minimum | Median | Maximum | Industry average* |
|---|---|---|---|---|---|---|
| Nursery dataset | ||||||
| Initial BW, kg | 4960 | 5.5 (0.49) | 2.8 | 5.4 | 9.1 | NA |
| Final BW, kg | 4960 | 26.6 (6.71) | 8.0 | 26.2 | 49.6 | 23.6 |
| Average DOF, No. | 4960 | 55.3 (12.06) | 22.8 | 53.4 | 115.2 | 46.3 |
| Mortality, % | 4960 | 4.1 (4.84) | 0.0 | 2.6 | 53.4 | 4.8 |
| ADG, g | 4960 | 370 (67.5) | 86 | 376 | 603 | 376 |
| ADFI, g | 4846 | 630 (140.8) | 186 | 617 | 1270 | 570 |
| G:F, g/kg | 4846 | 602 (90.4) | 185 | 617 | 974 | 660 |
| Finisher dataset | ||||||
| Initial BW, kg | 5269 | 27.0 (8.1) | 10.1 | 25.9 | 68.6 | NA |
| Final BW, kg | 5269 | 125.3 (3.87) | 101.6 | 125.3 | 138.4 | 128.0 |
| Average DOF, No. | 5269 | 112.4 (14.8) | 57.2 | 114.3 | 162.2 | 111.2 |
| Mortality, % | 5269 | 4.0 (2.57) | 0.0 | 3.4 | 26.3 | 4.6 |
| Dietary NE, kcal/kg | 5191 | 2626 (144.8) | 2423 | 2577 | 2949 | NA |
| ADG, g | 5269 | 871 (75.4) | 594 | 862 | 1347 | 926 |
| ADFI, g | 5264 | 2436 (229.2) | 1769 | 2413 | 3683 | 2386 |
| G:F, g/kg | 5264 | 358 (20.6) | 255 | 359 | 471 | 388 |
* Average of US swine industry productivity from 2013 to 2016.8
BW = body weight; NA = not available; DOF = days on feed; ADG = average daily gain; ADFI = average daily feed intake; G:F = gain to feed ratio; NE = net energy.
Nursery seasonality
A total of 4960 nursery observations were used in the final model for ADG and 4365 observations were used in the ADFI and G:F models (observations with descriptive variables coded as missing values were unavailable for analysis if the descriptive variables were included in the model; Table 4). Effects of system-flow, size, year, week, fill length, DOF, mortality, sowfarm, and feeder type as well as some of their interactions significantly (P < .10) contributed to the variability in growth responses among observations. Parameter coefficients and statistics for each model are provided in the supplementary material. Because there was no evidence of system-flow × week or size × week interactions for ADG and ADFI (P > .10), only main effects of week (P < .001) were reported. Plots of week of placement least squares means for ADG (Figure 4A) and ADFI (Figure 5A) indicated considerable variation among contiguous weeks. Thus, a rolling average was adopted to describe the seasonal patterns (Figures 4B and 5B), similar to the approach of Bahnson and Dial.3
Table 4: Multi-level linear mixed model components for nursery ADG, ADFI, and G:F in three swine production systems located in the midwestern United States from January 2013 to December 2017
| Source of variation | P value* | ||
|---|---|---|---|
| ADG (n = 4960) | ADFI (n = 4365) | G:F (n = 4365) | |
| System-flow†| < .001 | < .001 | < .001 |
| Batch size | < .001 | < .001 | NS |
| Year | < .001 | < .001 | < .001 |
| Week of placement (week) | < .001 | < .001 | NS |
| Length of fill period (fill) | .24 | .017 | NS |
| Average DOF | < .001 | < .001 | < .001 |
| Mortality | < .001 | < .001 | < .001 |
| Number of sow farm sources (sowfarm) | < .001 | < .001 | NS |
| Feeder type | NS | < .001 | < .001 |
| System-flow × size | NS | < .001 | NS |
| System-flow × year | < .001 | < .001 | < .001 |
| System-flow × fill | < .001 | < .002 | NS |
| System-flow × DOF | < .001 | < .001 | < .001 |
| System-flow × mortality | < .001 | < .001 | < .001 |
| Size × year | .004 | NS | NS |
| Size × fill | NS | .02 | NS |
| Size × sowfarm | < .001 | < .001 | NS |
* Multi-level linear mixed models for nursery dataset; model components were selected using a guided stepwise selection method with P < .10 considered statistically significant.
† The system and flow variables were merged in the nursery dataset to form a 7-category variable termed system-flow: system A-converted_nursery, system A-nursery, system A-WF_nursery, system B-nursery, system B-WF_nursery, system C-nursery, and system C-WF_nursery.
ADF = average daily gain; ADFI = average daily feed intake; G:F = gain to feed ratio; NS = not selected by the model; DOF = days on feed; WF = wean-to-finish.
Figure 4: Effect of week of placement on nursery ADG in three swine production systems located in the midwestern United States from January 2013 to December 2017. Values are presented as (A) least squares means with 95% confidence interval and (B) rolling average (window = 5, step size = 1) for changes in ADG relative to week 1. ADG = Average daily gain.
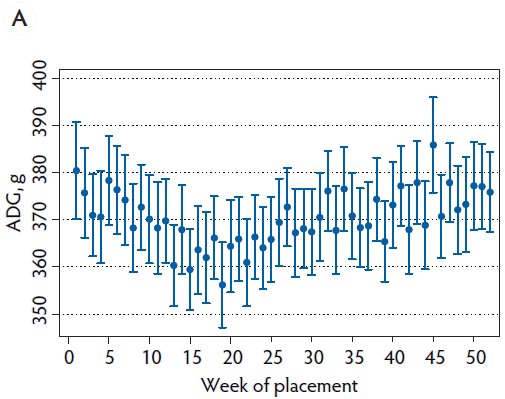
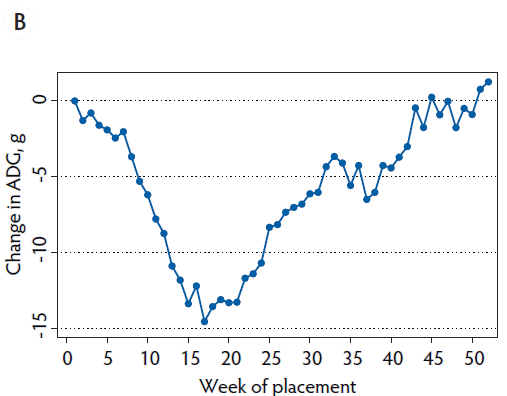
Figure 5: Effect of week of placement on nursery ADFI in three swine production systems located in the midwestern United States from January 2013 to December 2017. Values are presented as (A) least squares means with 95% confidence interval and (B) rolling average (window = 5, step size = 1) for changes in ADFI relative to week 1. ADFI = average daily feed intake.
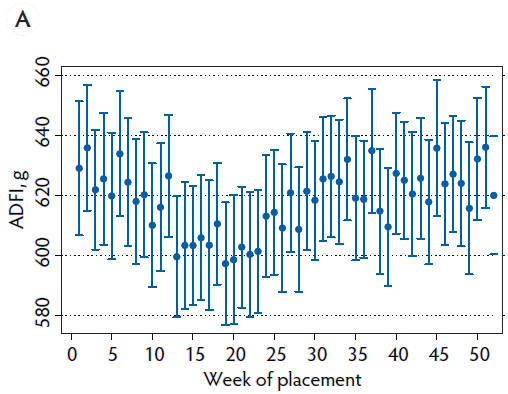
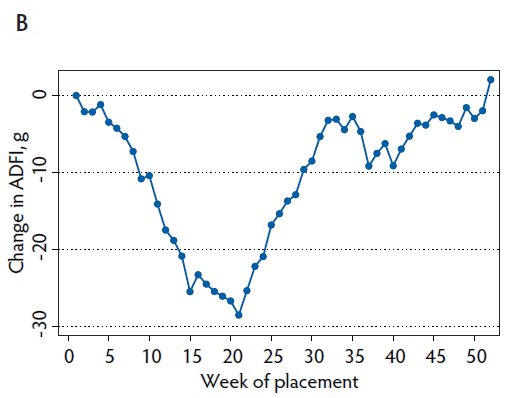
Nursery ADG and ADFI progressively decreased as the time of placement transitioned from the 1st to 15th week of the year. Both ADG and ADFI remained low during week 15 to 22 but increased thereafter and became equal to week 1 values by the 43rd and 33rd week of the year, respectively. Interestingly, a second but short period of decrease and recovery in both ADG and ADFI was observed during week 35 to 40 with a diminished magnitude. For G:F, there was no evidence of a week effect in nursery growth performance.
Finisher seasonality
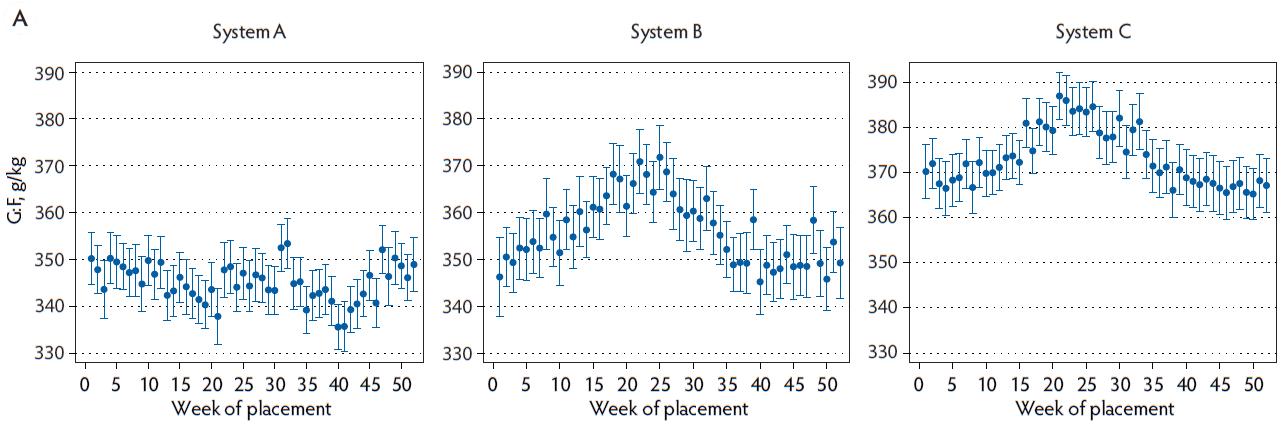
A total of 4747 finisher observations were used in the final model for ADG and 4743 observations were used in the ADFI and G:F models (Table 5). Effects of system, flow, size, year, week, fill length, initial BW, mortality, sowfarm, feeder, and NE as well as some of their interactions significantly (P < .10) contributed to the finisher models. System × week interactions (P < .001) were observed for ADG, ADFI, and G:F (Figures 6, 7, and 8, respectively).
Table 5: Multi-level linear mixed model components for finisher ADG, ADFI, and G:F in three swine production systems located in the midwestern United States from January 2015 to December 2017
| Source of variation | P value* | ||
|---|---|---|---|
| ADG (n = 4747) | ADFI (n = 4743) | G:F (n = 4743) | |
| System | < .001 | < .001 | < .001 |
| Flow | .002 | .003 | < .001 |
| Batch size | .02 | .018 | .04 |
| Year | < .001 | .04 | < .001 |
| Week of placement (week) | < .001 | < .001 | < .001 |
| Length of fill period (fill) | NS | .24 | .99 |
| Initial BW | < .001 | < .001 | < .001 |
| Mortality | < .001 | < .001 | < .001 |
| Number of sow farm sources (sowfarm) | .68 | .11 | < .001 |
| Dietary NE | < .001 | < .001 | < .001 |
| Feeder type | < .001 | < .001 | NS |
| System × flow | < .001 | < .001 | < .001 |
| System × size | < .001 | .018 | < .001 |
| System × year | .004 | < .001 | < .001 |
| System × week | < .001 | < .001 | < .001 |
| System × fill | NS | .095 | < .001 |
| System × initial BW | < .001 | < .001 | < .001 |
| System × mortality | .01 | NS | < .001 |
| System × sowfarm | < .001 | < .001 | NS |
| System × NE | NS | < .001 | < .001 |
| System × feeder | .002 | .004 | NS |
| Flow × size | NS | NS | < .001 |
| Flow × year | < .001 | < .001 | NS |
| Flow × fill | NS | < .001 | NS |
| Flow × initial BW | .04 | NS | NS |
| Flow × mortality | < .001 | < .001 | NS |
| Flow × sowfarm | NS | < .001 | < .001 |
| Flow × NE | .015 | .002 | NS |
| Size × fill | NS | .01 | NS |
| Size × initial BW | NS | NS | NS |
| Size × mortality | NS | NS | .09 |
| Size × sowfarm | .007 | .006 | .006 |
| Size × feeder | NS | < .001 | NS |
* Multi-level linear mixed models for the finisher dataset; model components were selected using a guided stepwise selection method with P < .10 considered statistically significant.
ADG = average daily gain; ADFI = average daily feed intake; G:F = gain to feed ratio; NS = not selected by the model; BW = body weight; NE = net energy.
Figure 6: Effect of week of placement on finisher ADG in three swine production systems located in the midwestern United States from January 2015 to December 2017. Values are presented as (A) least squares means with 95% confidence interval and (B) rolling average (window = 5, step size = 1) for changes in ADG relative to week 1. ADG = average daily gain.
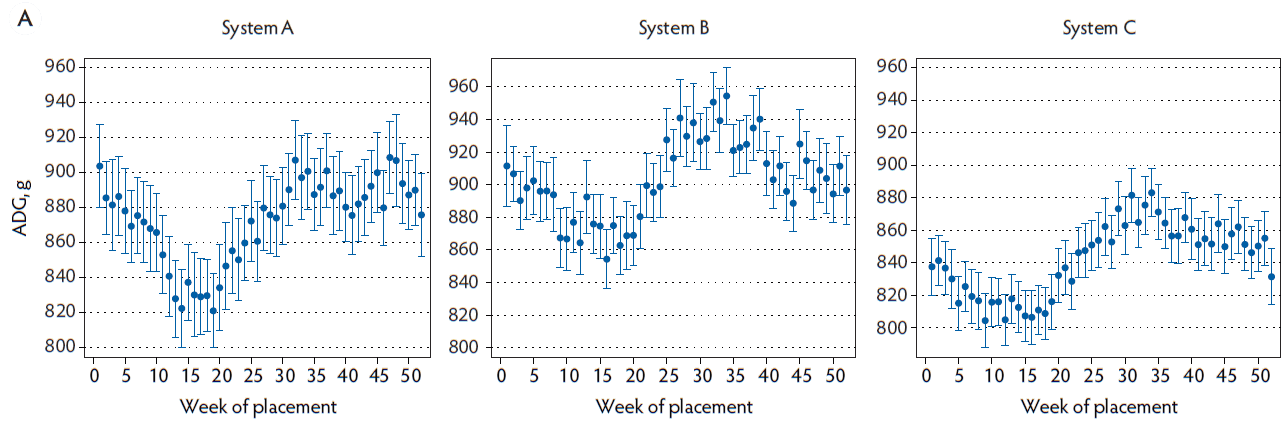
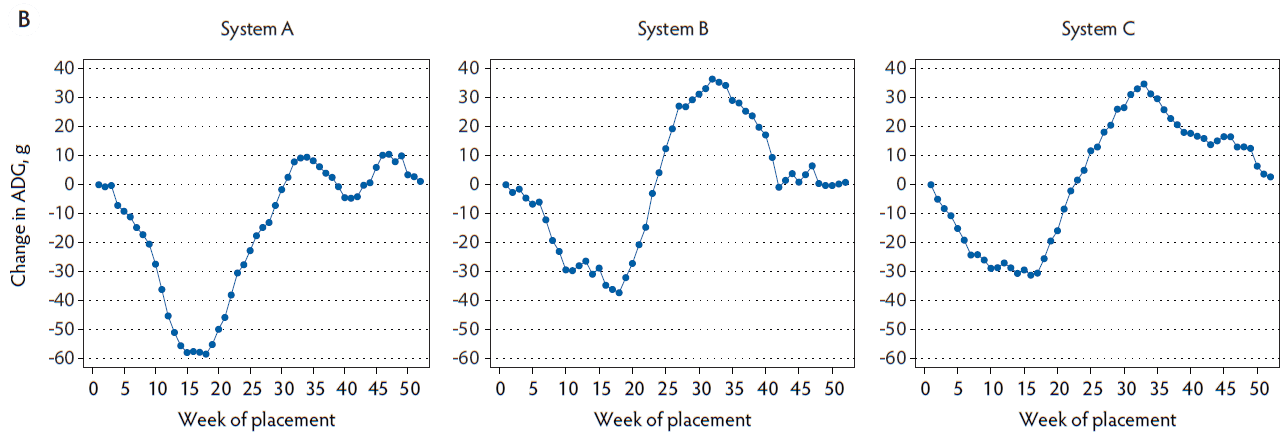
Figure 7: Effect of week of placement on finisher ADFI in three swine production systems located in the midwestern United States from January 2015 to December 2017. Values are presented as (A) least squares means with 95% confidence interval and (B) rolling average (window = 5, step size = 1) for changes in ADFI relative to week 1. ADFI = average daily feed intake.
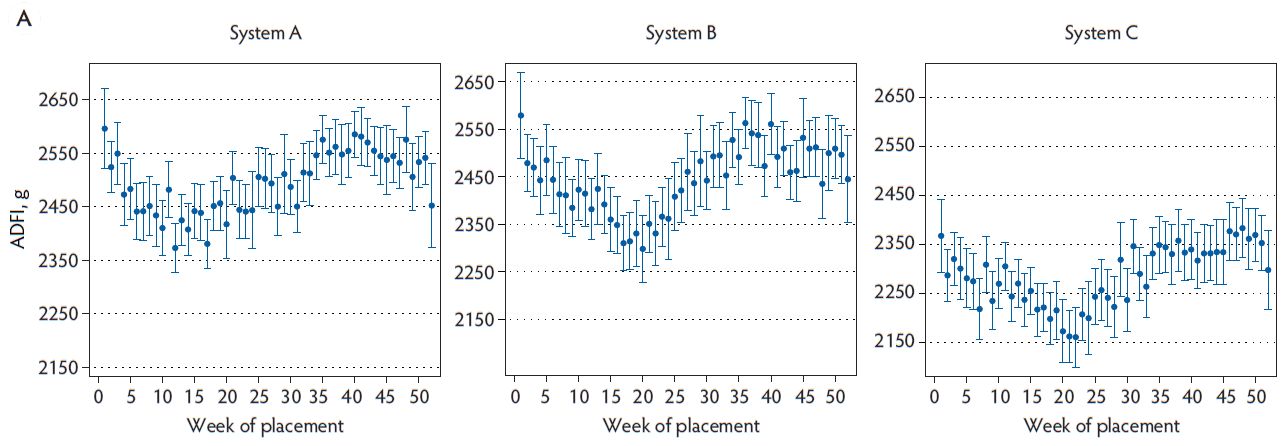
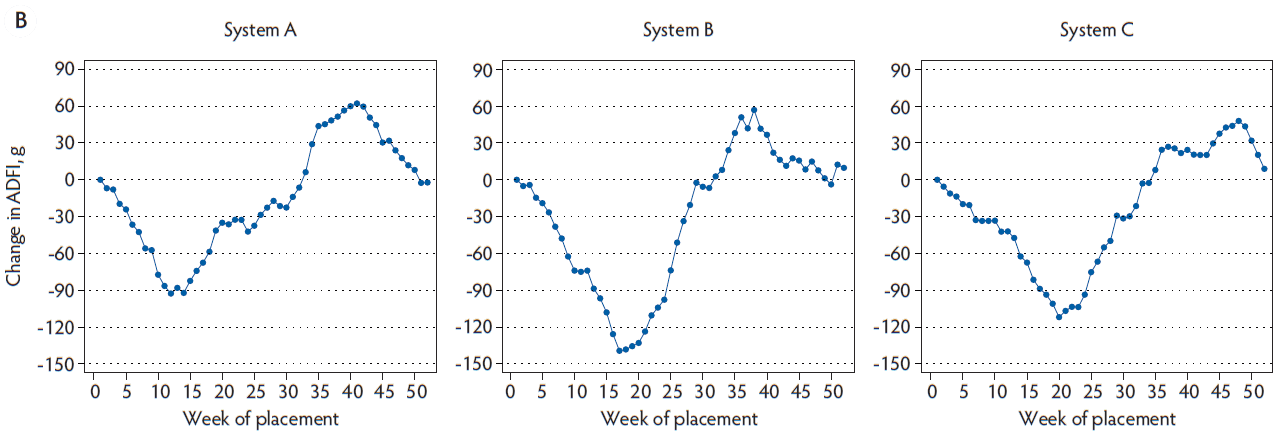
Figure 8: Effect of week of placement on finisher G:F in three swine production systems located in the midwestern United States from January 2015 to December 2017. Values are presented as (A) least squares means with 95% confidence interval and (B) rolling average (window = 5, step size = 1) for changes in G:F relative to week 1. G:F = gain to feed ratio.
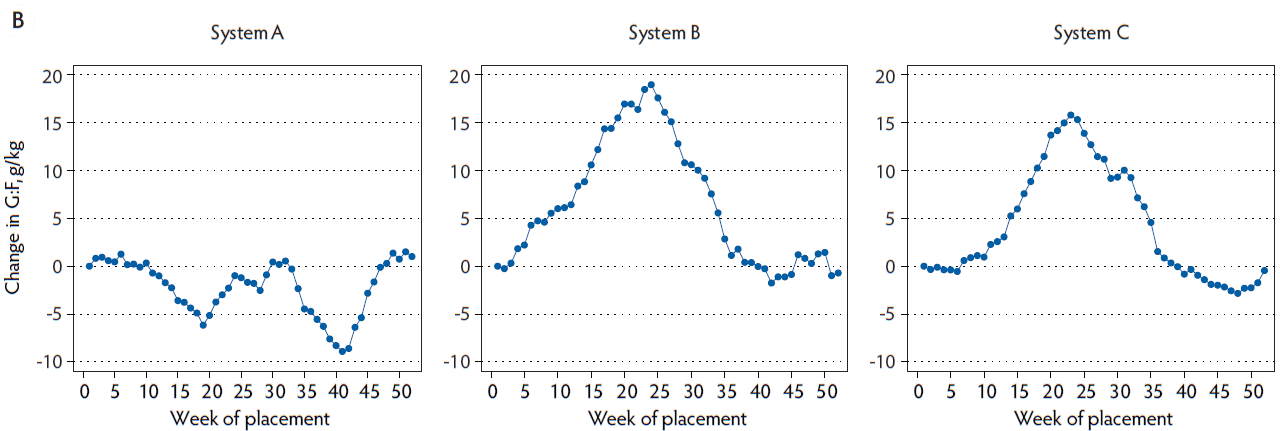
In system A, ADG decreased as the time of placement transitioned from week 1 to 15, remained low from week 15 to 20, and increased thereafter; shortly after a plateau around week 33, a second period of decrease and recovery in ADG was observed during week 33 to 45 with diminished magnitude. In systems B and C, ADG decreased during the first 10 weeks of the year, followed by a period of low ADG from week 10 to 20; thereafter, ADG increased, reached a plateau around week 30, and then decreased to the performance level observed in week 1.
For ADFI, seasonal patterns were generally similar among systems. Average daily feed intake decreased as the time of placement transitioned during the first 15 weeks of a year, increased for pigs placed from week 20 to 35, reached a plateau, and then decreased to week 1 level. However, the magnitude of the first period of decrease was greater in system B compared with systems A and C (200, 140, and 120 g, respectively). Moreover, the plateau of the ADFI curve remained longer in system C (approximately 15 weeks from week 35 to 50) compared with systems A and B (approximately 7 weeks occurring primarily around weeks 35 to 40).
Distinct seasonal patterns for G:F were observed among systems. In system A, two short periods of G:F decrease and recovery was observed from week 10 to 25 and from week 30 to 50, with the magnitude of decrease smaller during the first than the second period. In systems B and C, G:F increased during the first 20 to 25 weeks of the year and then decreased to the week 1 level by week 35.
Discussion
Seasonal variations have been widely observed in swine production, primarily due to the seasonal changes in environmental temperature.1-3 In this study, we constructed a multi-level linear mixed model that determined the seasonal patterns of ADG, ADFI, and G:F in three US production systems while controlling for variability in growth performance resulting from differences in system, type of pig flow, batch size, year, strategy of barn filling, feeder type, and dietary NE. Because the three systems were generally located nearby and within the midwestern United States, geographic factors were not considered in the model due to data availability and similar seasonal patterns among systems were initially hypothesized. In addition, because genetic information was not available at the batch level for analysis, it was assumed that genetic lines and rate of improvement were consistent within system and the genetic variability could be controlled by the fixed effects of system and year. It is also worth noting that even though our datasets provided a large number of observations per week (average 95 and 101 batches per week in nursery and finisher datasets, respectively), within-site replication per week was limited because relatively few sites are filled during the same week in multiple years. Therefore, site and week of placement were confounded, which might have contributed to the variability in least squares means among contiguous weeks (Figures 4A, 5A, 6A, 7A, and 8A). However, such differences among week of placement means were not always biologically significant from a production perspective.2
To evaluate the impact of increasing replications over year on the finisher seasonality models, a separate analysis was conducted using five years (2013 to 2017) of finisher data from systems B and C (system A was excluded because of lacking NE data from 2013 to 2014). Seasonality curves generated from the 5-year dataset (data not shown) followed similar patterns as those generated from the 3-year dataset. Moreover, ventilation design (tunnel versus curtain) was included in the 5-year (systems B and C only) models; there was no evidence that seasonal patterns for finisher growth performance were dependent on ventilation type (data not shown).
In this analysis, there were seasonal patterns in ADG and ADFI for both nursery and finisher datasets. In general, ADG decreased as the time of placement progressed during the first 15 weeks of the year and remained at that level for another 5 to 10 weeks, which was driven by a similar decrease in ADFI. In another retrospective study conducted in 1995, Bahnson and Dial3 determined the seasonal growth patterns in a commercial swine production system located in the midwestern United States; interestingly, the seasonal changes in finisher ADG and ADFI reported by these authors shared a nearly identical pattern and magnitude as that in system A and was generally in agreement with the other two systems from the present study. It was not surprising that ADG and ADFI decreased as the time of placement transitioned from winter to spring, because the average ambient temperature likely increased during the corresponding feeding periods. For instance, pigs that were placed in the barn around week 10 to 20 would have experienced the summer weather during June, July, and August, corresponding to the hottest season of a year in that region. It has been well demonstrated that pigs reduce voluntary feed intake in response to high ambient temperature.9-11 As expected, the seasonal ADG and ADFI curves reached the minimum approximately 5 weeks later in nursery than in finisher due to a shorter feeding length and delayed time of entry during the summer weather. However, finisher growth performance recovered faster than nursery and further increased beyond the week 1 level as the week of placement transitioned into fall (after week 25). Interestingly, a second period of decrease in nursery ADG and ADFI was observed from week 35 to 40; even though the magnitude of this decrease was marginal, it was consistently observed across systems. A similar pattern was also observed in finishing pigs from system A. Assuming a lactation period of 21 days, nursery pigs that were placed around week 35 to 40 would have been born and nursed during August and might have also experienced in-utero heat stress during June and July. It is possible that extreme temperatures during the summer may have negatively affected late-gestation and lactating sow performance and subsequently decreased growth performance of piglets. Heat stress during late gestation has been demonstrated to decrease the number of piglets born alive and piglet birth weight,12 and many studies have reported decreased lactating sow feed intake and piglet weaning weight during lactation under heat stress.13-15
The magnitude of seasonal variability (difference between the highest and lowest performance of the year) represented approximately 5% of the mean ADG or ADFI in nursery pigs, in contrast to approximately 9% in finisher growth performance. A greater seasonality impact on finisher performance is expected because heavier pigs are more sensitive to high ambient temperature and express greater reduction in appetite and growth during the summer compared with nursery pigs.1,9 Nevertheless, seasonality effects on G:F were observed in finisher but not in nursery pigs. In systems B and C, G:F increased in finishing pigs fed during the summer. This observation is consistent with findings of another retrospective study using data from nearly 60,000 commercial gilts over 2.5 years, where greater G:F was observed in pigs raised during the summer than winter (357 vs 312 g/kg, respectively).2 Improved G:F during the summer may be attributed to the decreased voluntary feed intake and the potential for pigs to utilize less feed for fat deposition (thermal insulation) and maintenance of body temperature.10 However, it merits further investigation on the reason why system A expressed less seasonal change in G:F compared with systems B and C.
Our models suggest that seasonal patterns for nursery responses were similar among systems and different pig-flow types, while finisher performance patterns were system dependent (system × week interaction). In nurseries, tight regulation of barn temperature and a relatively consistent diet regimen over time might have resulted in systems sharing similar seasonal patterns. In contrast, for finishers, different systems responded to seasonal change by employing different feeding strategies; for example, a considerable portion of pigs from systems A and C received summer diets with increased dietary NE, while system B did not change dietary NE over season. However, including dietary NE in the finisher models did not fully explain the differences in seasonal patterns among systems. Other factors that might have led to this interaction include management practice, marketing strategy, and other nutritional interventions (eg, addition of ractopamine). Moreover, it is possible that assumptions about the effects of genetic differences and geographical locations are negligible among systems may have been violated and partly contributed to the system × week interaction.
In commercial swine production, application of seasonality curves for growth performance include, but are not limited to, feed usage estimation and marketing projection. Users can predict ADFI of a production batch at the time of placement based on observed ADFI of pigs from a benchmark week along with the standardized differences among weeks presented as the rolling average curve. Total feed usage of a batch of pigs can be estimated by multiplying the predicted ADFI by pig inventory. Likewise, pig ADG can be estimated at the time of placement and thus the length of feeding period and marketing date can be determined by dividing the difference between targeted market weight and initial BW by the estimated ADG. For more precise estimation of growth responses, users need to adjust for other descriptive factors, eg, pig flow, dietary NE, feeder type, and pig initial BW, using the coefficients presented in the supplementary material.
In addition, caution is needed when applying a uniform seasonality curve to various finisher production systems because seasonal growth patterns of finishing pigs appear to be system dependent (system × week interaction). Systems that share little similarity (eg, geographic location) with the systems studied herein can generate their seasonal growth patterns using the methodology described in this study along with the code for the statistical analysis provided in the supplementary material.
In summary, this retrospective analysis depicts the seasonal patterns of nursery and finisher growth performance in three commercial swine production systems located in the midwestern United States. Nursery ADG and ADFI expressed prominent seasonal variations and were similar among systems, whereas nursery G:F was not affected by season. Finisher ADG, ADFI, and G:F varied over seasons but the magnitudes and patterns of change were system dependent. This study also presents concepts underlying the implementation of a multi-level linear mixed model of production records to analyze seasonality and potentially other decision factors in commercial systems.
Implications
- Seasonal variabilities in pig growth performance were observed in both commercial nurseries and finishers and can be quantified using a modeling approach based on production records.
- Seasonal patterns for nursery growth performance were similar among investigated systems, while seasonality effects on finisher performance was system dependent.
Acknowledgements
Appreciation is expressed to Genus PIC for their support in data collection. Special appreciation is also expressed to Dr Leilei Shen for her support and expertise in statistical analysis.
Conflict of interest
None reported.
Disclaimer
Scientific manuscripts published in the Journal of Swine Health and Production are peer reviewed. However, information on medications, feed, and management techniques may be specific to the research or commercial situation presented in the manuscript. It is the responsibility of the reader to use information responsibly and in accordance with the rules and regulations governing research or the practice of veterinary medicine in their country or region.
References
1. Nardone A, Ronchi B, Lacetera N, Bernabucci U. Climatic effects on productive traits in livestock. Vet Res Commun. 2006;30:75-81.
2. Lewis CR, Bunter KL. Effects of seasonality and ambient temperature on genetic parameters for production and reproductive traits in pigs. Anim Prod Sci. 2011;51:615-626.
*3. Bahnson P, Dial G. Factors associated with output and efficiency in growing and finishing swine. Proc AASP. Omaha, Nebraska. 1995:305-310.
4. St-Pierre NR, Cobanov B, Schnitkey G. Economic losses from heat stress by US livestock industries. J Dairy Sci. 2003;86(E. Suppl.):52-77.
*5. Chen X, Ender P, Mitchell M, Wells C. Regression with Stata. UCLA Institute for Digital Research and Education. https://stats.idre.ucla.edu/stata/webbooks/reg/chapter2/stata-webbooksregressionwith-statachapter-2-regression-diagnostics/. Published 2003. Accessed May 15, 2018.
6. Kass RE, Raftery AE. Bayes factors. J Am Stat Assoc. 1995;90:773-795.
*7. StataCorp. Stata 15 base reference manual. College Station, TX: Stata Press. 2017.
*8. Stalder KJ. 2016 Pork industry productivity analysis. https://www.pork.org/wp-content/uploads/2017/11/2017-pork-industry-productivity-analysis.pdf. Published 2017. Accessed May 15, 2018.
9. Renaudeau D, Gourdine JL, St-Pierre NR. A meta-analysis of the effects of high ambient temperature on growth performance of growing-finishing pigs. J Anim Sci. 2011;89:2220-2230.
10. Trezona M, Mullan BP, D’Antuono M, Wilson RH, Williams IH. The causes of seasonal variation in backfat thickness of pigs in Western Australia. Aust J Agric Res. 2004;55:273-277.
11. Schinckel AP, Schwab CR, Duttlinger VM, Einstein ME. Analyses of feed and energy intakes during lactation for three breeds of sows. Prof Anim Sci. 2010;26:35-50.
12. Nelson RE, Omtvedt IT, Turman EJ, Stephens DF, Mahoney GW. Effects of heat stress at various stages of pregnancy on sow productivity. Oklahoma Agricultural Experiment Station; 1970. 84:71-77.
13. Williams AM, Safranski TJ, Spiers DE, Eichen PA, Coate EA, Lucy MC. Effects of a controlled heat stress during late gestation, lactation, and after weaning on thermoregulation, metabolism, and reproduction of primiparous sows. J Anim Sci. 2013;91:2700-2714.
14. McGlone JJ, Stansbury WF, Tribble LF, Morrow JL. Photoperiod and heat stress influence on lactating sow performance and photoperiod effects on nursery pig performance. J Anim Sci. 1988;66:1915-1919.
15. Spencer JD, Boyd RD, Cabrera R, Allee GL. Early weaning to reduce tissue mobilization in lactating sows and milk supplementation to enhance pig weaning weight during extreme heat stress. J Anim Sci. 2003;81:2041-2052.
*Non-refereed references.