| Practice tip | Peer reviewed |
Cite as: Gonçalves MAD, Dritz SS, Tokach MD, et al. Fact sheet – Ingredient database management for swine: phosphorus. J Swine Health Prod. 2017;25(2):76–78. https://doi.org/10.54846/jshap/931
Also available as a PDF.
Keywords: swine, phosphorus, ingredient, database, management
Search the AASV web site
for pages with similar keywords.
Received: July 27, 2015
Accepted: September 16, 2016
Conflict of interest
None reported.
Disclaimer
Scientific manuscripts published in the Journal of Swine Health and Production are peer reviewed. However, information on medications, feed, and management techniques may be specific to the research or commercial situation presented in the manuscript. It is the responsibility of the reader to use information responsibly and in accordance with the rules and regulations governing research or the practice of veterinary medicine in their country or region.
This practice tip incudes a fact sheet on database management for phosphorus in swine diets.
Fact Sheet: Ingredient database management for swine: phosphorus
Fast facts
Defining available phosphorus (P) for ingredients is expensive and requires a growth assay and bone-sample collection. An alternative, standardized total tract digestible (STTD) P, is less expensive to perform since it requires only feed- and fecal-sample evaluation for P.
Formulating diets on an STTD P basis is more accurate than using total tract digestible P because STTD P accounts for basal endogenous gastrointestinal tract losses. Thus, the STTD P is additive when combining different ingredients used for diet formulation.
Phosphorus (P) is an inorganic element that is important for development and maintenance of the skeletal system.1 Diets formulated with excess P can have a negative impact on the environment due to increased P excretion.2 This fact sheet will briefly explain the different ways that P can be expressed, how to assign a phosphorus (P) value to an ingredient, and the effects of naturally occurring phytase and diet form on P digestibility. Phosphorus can be expressed as total or bioavailable.
Total P
Total P represents all P that the ingredient contains, including the non-available P, which is mostly bound in phytic acid and represents 60% to 75% of the total P in cereal grains and oilseed meals.1,3 A limitation to using total P in diet formulation is that it provides no information on the amount of P that is available to the pig. Thus, the diet can appear to be adequate for total P, but may not actually meet the pig’s requirement. Total P also does not place any value on exogenous or endogenous phytase.
Bioavailable P
Bioavailable P is the proportion of P that can be absorbed and available for use or storage.4 The most common methods to estimate P bioavailability are the slope-ratio assay and digestibility experiments. The slope-ratio assay method theoretically estimates the digestible plus post-absorptive utilization of P at the tissue level and is known as available P (AvP), whereas digestibility experiments measure only digestible utilization, known as digestible P.5
Available P. In the slope-ratio assay method, linear regression is fitted to the response criterion (eg, growth performance or bone ash) for each set of titrated diets (new versus inorganic standard ingredient) and the slope of the equation from the ingredient is divided by the slope from the inorganic standard. The drawbacks of the slope-ratio assay method1,5 are mainly assumption that the inorganic standard is 100% bioavailable, thus it is important to use the same standard for all ingredients; dependence on the response criterion used (bone ash versus P retention); and relatively high cost to perform. As there are no inorganic P sources that are 100% bioavailable, it is important to note that the values obtained using this methodology are relative bioavailability of the reference ingredients rather than true bioavailability. Thus, diets formulated on an available P basis may overestimate the true P being utilized.
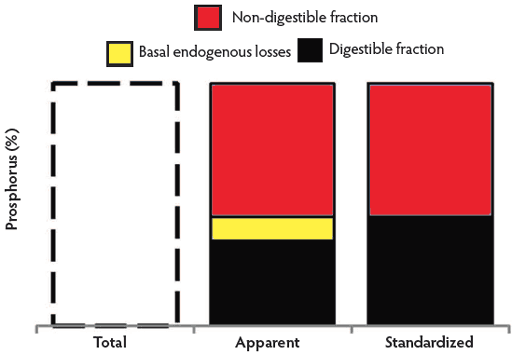
Digestible P. Digestible P can be expressed as apparent total tract digestible (ATTD) P or standardized total tract digestible (STTD) P. The difference between ATTD P and STTD P is that STTD P corrects for basal endogenous P losses (Figure 1). The concept of STTD P is similar to the concept of standardized ileal digestible amino acids, because there is no net P absorption or secretion in the large intestine.1 The main drawback of the ATTD P method is that it underestimates the true amount of digestible P, because it does not account for basal endogenous losses. Basal endogenous losses account for approximately 25.6% of the animal’s daily P requirement;5 therefore, expressing P on an STTD basis is more accurate than expressing it on an ATTD basis. After correcting for basal endogenous losses, STTD is additive for diet formulation, resulting in a more appropriate estimation of the digestible P concentration in the diet.
Figure 1: Total, apparent digestible, and standardized digestible phosphorus (P) and their respective fractions.
How to assign P diet formulation values to a new ingredient
To assign or update a P ingredient value, two steps are needed.
Analyze the ingredient samples for total P. This step is simple and low cost and requires only a total P analysis of the ingredient.
Assign a digestibility value. Different databases in the literature express P on different bases (Table 1). One approach is to search for information in the scientific literature for estimates of a P digestibility. If the unknown new ingredient has similar characteristics, such as processing method or amount of phytate, this would be a reasonable starting point. Thus, for an unknown new ingredient, unless a digestibility trial is conducted, the nutritionist should use values from the most similar ingredient listed in published information. Another option would be to use the chemical analysis provided by the supplier. Finally, if no reference ingredient is available, one software program uses a default apparent P digestibility value of 20%.7
Table 1: Comparison of phosphorus availability and digestibility percentages from different sources
| NRC (1998)6 | NRC (2012)1 | EvaPig7 | ||
|---|---|---|---|---|
| Ingredient | Availability (%) | ATTD (%) | STTD (%) | ATTD (%) |
| Corn | 14 | 26 | 34 | 28 |
| Soybean meal | 23 | 39 | 48 | 32 |
What is the impact of naturally occurring phytase and diet form on P digestibility?
Naturally occurring phytase (also known as endogenous dietary phytase) influences the P digestibility of some ingredients, such as wheat and wheat by-products.1,6 However, pelleting can inactivate the naturally occurring phytase in these ingredients.1,6 For example, apparent P digestibility in wheat middlings is 50% in mash diets, but only 25% in pelleted diets. Naturally occurring phytase is assumed to have an additive effect with exogenous phytase.6 In pelleted diets, only exogenous phytase contributes to P release, assuming the exogenous phytase is heat stable or applied post pelleting.6 EvaPig accounts for naturally occurring phytase and the impact of diet form on P digestibility.7 Even though NRC (2012)1 acknowledges the effects of naturally occurring phytase in wheat and its by-products and the negative effects of pelleting on endogenous dietary phytase, no adjustments are made in the ingredient values of NRC to account for these factors. Brief reviews about phytase and comparing different sources have been provided previously.8,9
Acknowledgement
Contribution no. 16-052-J from the Kansas Agricultural Experimental Station, Manhattan, KS 66506-0210.
References
1 . NRC. Minerals. In: Nutrient Requirements of Swine. 11th rev ed. Washington, DC: National Academy Press; 2012:74–103.
2. Kornegay ET, Harper AF. Environmental nutrition: Nutrient management strategies to reduce nutrient excretion of swine. The Professional Animal Scientist. 1997;13:99–111.
*3. Urriola PE, Shurson GC. Nutritional requirement for calcium, phosphorus, and vitamin D in pigs. Proc Allen D. Leman Swine Conference. St Paul, Minnesota. 2013;151–156.
4. Srinivasan VS. Bioavailability of nutrients: a practical approach to in vitro demonstration of the availability of nutrients in multivitamin-mineral combination products. J Nutr. 2001;131:1349–1350.
5. Shen Y, Fan MZ, Ajakaiye A, Archbold T. Use of the regression analysis technique to determine the true phosphorus digestibility and the endogenous phosphorus output associated with corn in growing pigs. J Nutr. 2002;132:1199–1206.
6. NRC. Minerals. In: Nutrient Requirements of Swine: 10th rev ed. Washington, DC: National Academy Press; 1998:47–70.
7. EvaPig. 2008. Evaluation of pigs feed. Reference manual. Available at http://www.evapig.com/IMG/pdf/EvaPigManual-2.pdf. Accessed 25 September 2016.
8. Gonçalves MAD, Dritz SS, Tokach MD, DeRouchey JM, Woodworth JC, Goodband RD. Fact sheets – comparing phytase sources for pigs and effects of superdosing phytase on growth performance of nursery and finishing pigs. J Swine Health Prod. 2016;24:97–101.
9. Jacela JY, DeRouchey JM, Tokach MD, Goodband RD, Nelssen JL, Renter DG, Dritz SS. Feed additives for swine: Fact sheets – high dietary levels of copper and zinc for young pigs, and phytase. J Swine Health Prod. 2010;18:87–91.
* Non-refereed reference.