| Practice tip | Peer reviewed |
Cite as: Gonçalves MAD, Dritz SS, Tokach MD, et al. Fact sheets – Ingredient database management: Part I, overview and sampling procedures and Part II, energy. J Swine Health Prod. 2016;24(4):216–221. https://doi.org/10.54846/jshap/930
Also available as a PDF.
Keywords: swine, energy, net energy, feeding value, feed sampling
Search the AASV web site
for pages with similar keywords.
Received: July 29, 2015
Accepted: Part I, January 20, 2016; Part II, April 26, 2016
This practice tip includes fact sheets on sampling procedures for ingredients and assigning net energy values to ingredients.
Conflict of interest
None reported.
Disclaimer
Scientific manuscripts published in the Journal of Swine Health and Production are peer reviewed. However, information on medications, feed, and management techniques may be specific to the research or commercial situation presented in the manuscript. It is the responsibility of the reader to use information responsibly and in accordance with the rules and regulations governing research or the practice of veterinary medicine in their country or region.
FACT Sheet: Ingredient database management. I. Overview and sampling procedures
Fast facts
Maintaining an accurate ingredient database is important for predictable growth performance of pigs and economic optimization of the production system.
A standardized sampling procedure is key to manage a successful ingredient database.
Chemical analysis to verify ingredient database values is important for signaling the time when ingredient values should be updated. To maintain a consistent database, appropriate sampling procedure is needed.
Database management overview
A common best-practice for diet formulation ingredient database management is to start by selecting energy and nutrient values for ingredients from one or more sources, such as the National Research Council (NRC).1 It should be noted that selecting values from different ingredient databases can be problematic, primarily concerning energy, fiber, and other components where quality control of assays is poor and different methods are utilized. It is generally best to select one database and use it to the maximum extent possible. Ingredient chemical analysis can be used to confirm or modify differences in nutrient profiles from reference sources, customizing to specific ingredient sources or local agronomic conditions. Additionally, as new alternative ingredients are available in the market, accurate estimations of their nutrient profiles are necessary. Therefore, a critical factor in obtaining accurate ingredient analysis is appropriate sampling.
Sampling procedures
The sampling procedures2,3 are separated into four steps, shown below.
Steps in sampling feed ingredients
1. Define the number of samples to be collected;
2. Select the appropriate equipment for sampling;
3. Define the sampling location and size; and
4. Thoroughly mix subsamples and conduct a sample reduction (samples often must be blended and sample size reduced for analysis).
Number of samples
To determine the number of samples needed, one must have previous information from the standard deviation of the chemical analysis (ie, from NRC or farm-specific information). For example, if the goal is to collect the correct number of samples to estimate the crude protein of soybean meal within 0.5%, one can determine the number of samples by using the equation
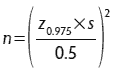
where z0.975 is 1.96 for a 95% confidence interval, s is the standard deviation of the sample, and n is the number of samples needed. If crude protein in soybean meal has a standard deviation of 0.99, then
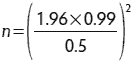
Thus, n = 15 samples are needed.
If one is sampling from bagged or sacked products, the number of bags to sample may vary with the size of the load or shipment. For bagged shipments with multiple pallets, sample each pallet to reach the total number of samples required (ie, 15 samples total and three pallets: five samples should be collected from each pallet). For shipments involving different lots, obtain a sample from each lot and retain separately. If sampling from bulk products loaded into vehicles with multiple compartments, sample each compartment to reach the total number of samples required (ie, 15 samples total and three compartments: collect five samples from each compartment).
Sampling equipment
The correct selection of sampling equipment is necessary to obtain a representative sample. The most common sampling equipment is the slotted grain probe (Figures 1 and 2), which can be manual or automated.2,3 Probes are available in a variety of sizes to appropriately sample the bag, container, or truck where a representative sample is being obtained. For trucks or railcars, the cylinder slotted or automatic probe should be long enough to reach the bottom of the vehicle to obtain samples. The slotted grain probe must be inserted in the closed position, and once in place, opened to obtain a representative sample. If this procedure is followed, the slotted grain probe has the advantage of obtaining a sample throughout the entire depth of the material.
Figure 1: Manual slotted grain probe diagram. Reproduced with permission from Herrman.3
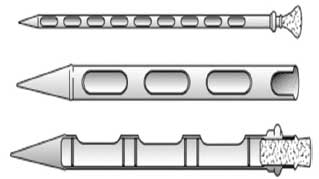
Figure 2: Manual slotted grain probe. Reproduced with permission from Herrman.3

Sampling location and size
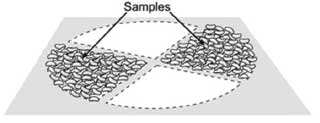
Sampling patterns by probe should ensure that a representative sample is collected. For bulk grain, Figure 3 shows an example of locations for collection from a vehicle (truck or railcar). This pattern may be varied, but demonstrates product in two compartments being sampled. If only one probe is collected, particular care should be taken to vary the compartment and location within the compartment during sampling. Some automatic probes collect sample only from the end of the probe, as opposed to its entire length. If this is the case, take care to vary the depth of the probe.
Figure 3: Example of locations for sampling (lateral and top view in a hopper-bottom truck).

While sampling by probe is the most common method, many mills instead either sample with a pelican sampler or with the catch method during unloading, ie, sampling from the moving stream of ingredient. Once again, as with probed samples, the number of samples collected is calculated on the basis of the ingredient’s expected variability and the desired confidence interval of the estimate. However, multiple samples should be collected at regular intervals of time throughout the discharge of the lot to be sampled. These samples are then pooled and reduced. If this is the case, the samples should be small collections. Regardless of the sampling method, the sample size for grain should not be less than 1 kg.2
When sampling bagged feeds and ingredients (Figure 4), insert the probe or bag trier diagonally, so that it reaches the opposite corner. Withdraw the probe and pour the sample into a container. Approximately 500 g should be collected from each bag. If the lot is 10 bags or fewer, sample each bag; if the lot is 11 bags or more, select 10 bags representative of varying locations in the lot to sample.
Figure 4: Bagged-ingredient sampling

Liquid ingredients and fats. Sampling procedures for liquid ingredients and fats use the same principles as for sampling dry ingredients, but with modified liquid probes or collection devices that can be affixed to hoses to collect representative samples during unloading.2
Aseptic feed sampling. When sampling feeds or ingredients for analysis of biological hazards, use aseptic sampling.4 Further information on aseptic sampling can be found at https://www.youtube.com/watch?v=dX6BLn9WKGE&feature=youtu.be.
Sample reduction
If sample reduction is necessary, thoroughly mix subsamples. The samples can be split with a riffle divider2 (Figure 5) or by the quartering method (Figure 6). For proper division using a riffle divider, pour the sample evenly over the divider, then combine the catch pans and pour the combined sample through the divider a second time. One of the pans can then be discarded and the process repeated to reduce sample size. The desirable end result will be two samples of approximately 500 g each: one that may be submitted for chemical analysis and a second that may be retained as a backup. Normally, the samples are retained until the livestock are slaughtered.
Figure 5: Riffle divider. Reproduced with permission from Herrman.3
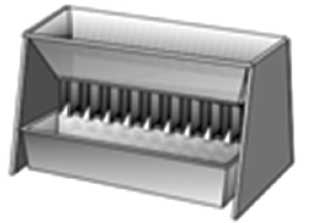
Figure 6: Quartering method. Reproduced with permission from Herrman.3
Implication
It is critical to obtain accurate nutrient values for all feed ingredients used in swine production by using a standardized sampling procedure to monitor chemical composition of incoming ingredients.
Acknowledgement
Contribution no. 16-049-J from the Kansas Agricultural Experiment Station, Manhattan, KS 66506-0210.
References
1. National Research Council. Nutrient Requirements of Swine. 11th rev ed. Washington, DC: National Academy Press; 2012:127–156.
2. National Grain and Feed Association. Model Feed Quality Assurance Program Notebook. 8th ed. Washington, DC. 2009:1–83.
*3. Herrman T. Sampling: Procedures for feed. 2001. Kansas State University Agricultural Experiment Station and Cooperative Extension Service. Available at http://www.ksre.k-state.edu/bookstore/pubs/mf2036.pdf. Accessed 25 January 2016.
4. Association of American Feed Control Officials. Feed Inspector’s Manual. 5th ed. Champaign, Illinois: AAFCO. 2014. Available at http://www.aafco.org/Portals/0/SiteContent/Publications/AAFCO_Feed_Inspectors_Manual_5th_ed.pdf. Accessed 29 March 2016.
* Non-refereed reference.
FACT sheet: Ingredient database management. II. Energy
Dietary energy is an important and expensive component of swine diet. The net energy (NE) system is the most correlated to performance1 compared to systems based on digestible and metabolizable energy. The most common ingredient values are from the National Research Council (NRC)2 and the French National Institute for Agricultural Research (INRA).3 A well-founded energy system in formulation is especially important with the increasing use of alternative ingredients.
Fast facts
There are different methodologies for assigning a net energy value to an ingredient; however, consistently using the same methodology to assign energy values to ingredients is essential for developing a successful database.
Of equal importance is to use net energy values for ingredients that match the net energy values used for requirements estimates.
How to assign or update energy values in ingredient databases
Ingredients with different chemical profiles will generally have different energy concentrations. In order to assign or update an energy value for an ingredient, different approaches are possible.
Estimation and validation trials
These approaches use experiments conducted in commercial research barns to generate more information regarding the ingredient.
Estimation trial. This approach uses energy efficiency of gain (kcal of NE per kg of gain) to estimate the NE per kg of the ingredient.4 After calculating the energy efficiency of gain, the researchers calculate what the energy content of the ingredient would be to provide the same energy efficiency as a standard corn-soybean-meal-based diet.
Validation trial. In this approach, the nutritionist assigns the estimated energy value and then conducts a trial with different inclusion rates of the ingredient compared to a standard corn-soybean-meal-based diet. The expectation is that any change in dietary energy will match performance across the different inclusion rates, as evaluated by the slope of the linear regression between feed efficiency and the ingredient inclusion rate.5
It must be noted that these approaches are not dynamic and do not take into account changes in chemical composition of the given ingredient over time.
NRC model equations
Different equations for predicting NE were presented by the NRC in 2012.2 However, the equation from Noblet et al6 was used in the NRC2 publication to calculate NE content of feedstuffs because of the difficulty in acquiring some of the nutrients required by other equations (eg, sugar, digestibility values). The equation by Noblet et al6 requires chemically analyzed values of crude protein (CP), acid detergent fiber (ADF), ether extract (EE), and starch values. Additionally, this equation requires a metabolizable energy (ME) value. Therefore, if no ME value is available for the ingredient, the ME equation presented in NRC2 can be used to estimate a ME value using ash, CP, EE, and neutral detergent fiber (NDF).
INRA/EvaPig software
INRA/EvaPig software3 (Saint-Gilles, France) integrates equations for several different classes of ingredients to predict a NE and nutrient profile. If the ingredient is biologically similar to any other ingredient family (cereals, cereal by-product, vegetable protein sources, dairy by-products, etc) one can use the most similar ingredient as reference. This method3 is recommended rather than creating an ingredient profile from scratch, because the energy values of the ingredient will be calculated by using specific energy equations related to the reference ingredient. For example, creating a cereal by-product with 88% dry matter (DM), 9% CP, 12% NDF, 3% ADF, 2% ash, 3% crude fat, and 63% starch, and using corn as the reference ingredient in EvaPig, the ingredient is calculated with 2588 kcal of NE per kg for growing pigs, whereas corn in EvaPig is estimated at 2651 kcal of NE per kg.
If there is no available ingredient or family of ingredients to use as reference, then an ingredient can be created using equations in the software. To calculate the ME or NE value of the ingredient, the chemical analysis of DM, ash, CP, NDF or ADF, and either crude fat or gross energy, are mandatory. Analysis of starch is required to calculate ME and NE. Analysis of sugars adds precision to the calculations. The EvaPig software manual3 has step-by-step instructions on this process. For example, the same cereal by-product described above is calculated as having 2580 kcal of NE per kg for growing pigs when using corn as the reference ingredient. When only the generic EvaPig equations are used, the estimate is slightly different (2580 kcal per kg). Additionally, this software accounts for differences in energy digestibility between the growing pigs and adult sows, while the NRC methods do not.7 It is important to note that estimates using prediction equations should use input values that are within the range used to generate the prediction equations.
Supplier information
Some nutritionists use energy values provided by the ingredient supplier. It is important to have an understanding of the methodology used to derive those values and to gauge if they are logical, given the chemical composition. Another method is to use chemical analysis provided by the supplier and use either the NRC model equations2 or INRA/Eva Pig software3 to predict the energy value.
Calculate energy value relative to a reference ingredient
Some nutritionists have a high degree of confidence in the energy value they use for a reference ingredient such as corn. Thus, they will use one of the methods described to generate an energy value for the unknown ingredient and use the same method to generate an energy value for their reference ingredient. If the generated value for the reference ingredient is different from the value in which they have a high degree of confidence, they adjust the calculated unknown ingredient value. The adjustment is made by multiplying the calculated unknown ingredient energy value by the ratio of the calculated reference ingredient value to the reference value in which they have a high degree of confidence. This method generates a relative value in which the ingredient is assigned an energy value relative to the nutritionist’s reference ingredient in which they have a high degree of confidence, in the same ratio of the calculated unknown to calculated reference ingredient values. The nutritionist then uses the adjusted value in their database. For example, the new ingredient is calculated as having 2000 kcal of NE per kg, whereas corn has a calculated value of 2651 kcal per kg; therefore, the ratio is 2000 ÷ 2651 = 0.754. In the nutritionist’s database, corn is valued at 2600 kcal NE per kg, so the new ingredient would be valued at 2600 × 0.754 = 1960 kcal NE per kg. If this approach is used, the reference ingredient must have a chemical profile (CP, NDF, EE, ash, starch) similar to the test ingredient. The energy values of common alternative ingredients presented as a ratio to corn are shown in Table 1.
Table 1: Energy value of feed ingredients related to that of corn for growing pigs
| Ingredient | NRC8 | EvaPig3 | ||
|---|---|---|---|---|
| ME | NE | ME | NE | |
| Corn | 100 | 100 | 100 | 100 |
| Corn DDGS (6%-9% oil) | 100 | 88 | 101 | 78 |
| Sorghum (milo) | 104 | 104 | 100 | 99 |
| Soybean meal, dehulled | 97 | 78 | 99 | 75 |
| Soybean hulls | 57 | 37 | 56 | 38 |
| Wheat middlings | 87 | 79 | 77 | 69 |
It is important to emphasize that consistently using the same methodology to assign energy values to ingredients is essential for developing a successful database. Additionally, it is of equal importance to use NE values for ingredients that match the NE values used for requirement estimates. For example, if the requirement estimate is derived from NRC,2 the NE ingredient values should be obtained from that source, not from the ingredient values in EvaPig.3
Acknowledgement
Contribution no. 16-050-J from the Kansas Agricultural Experiment Station, Manhattan, KS 66506-0210.
Disclaimer
Scientific manuscripts published in the Journal of Swine Health and Production are peer reviewed. However, information on medications, feed, and management techniques may be specific to the research or commercial situation presented in the manuscript. It is the responsibility of the reader to use information responsibly and in accordance with the rules and regulations governing research or the practice of veterinary medicine in their country or region.
References
1. Nitikanchana S, Dritz SS, Tokach MD, DeRouchey JM, Goodband RD, White BJ. Regression analysis to predict growth performance from dietary net energy in growing-finishing pigs. J Anim Sci. 2015;93:2826–2839.
2. NRC. Feed ingredient composition. In: Nutrient Requirements of Swine: 11th rev ed. Washington, DC: National Academy Press; 2012:239–242.
3. EvaPig. Evaluation of pig feeds. Reference manual. 2008. Available at: http://www.evapig.com/. Accessed 3 May 2016.
4. Hastad CW, Tokach MD, Goodband RD, Nelssen JL, Dritz SS, DeRouchey JM, Jones CL. Comparison of yellow dent and NutriDense corn hybrids in swine diets. J Anim Sci. 2005;83:2624–2631.
*5. Boyd RD, Zier-Rush CE, Fralick CE. Practical method for estimating productive energy (NE) of wheat middlings for growing pigs [abstract]. J Anim Sci. 2010;88:51.
6. Noblet J, Fortune H, Shi XS, Dubois S. Prediction of net energy value of feeds for growing pigs. J Anim Sci. 1994;72:344–354.
7. Le Goff G, Noblet J. Comparative total tract digestibility of dietary energy and nutrients in growing pigs and adult sows. J Anim Sci. 2001;79:2418–2427.
8. NRC. Model for estimating nutrient requirements of swine. In: Nutrient Requirements of Swine: 11th rev ed. Washington, DC: National Academy Press; 2012:127–156.
*Non-refereed reference.