Scolari SC, Clark SG, Knox RV, et al. Vulvar skin temperature changes significantly during estrus in swine as determined by digital infrared thermography. J Swine Health Prod. 2011;19(3):151–155
| Original research | Peer reviewed |
SummaryObjective: To determine if changes in vulvar skin temperature (VST), measured using infrared thermography (IRT), occur during estrus. Materials and methods: The experimental groups consisted of 25 gilts and 27 multiparous sows. Infrared VST and gluteal skin temperature (GST) were measured twice daily (8:00 am and 4:00 pm) using a thermal-imaging camera (Fluke IR FlexCam; Fluke Corporation, Everett, Washington). Once standing estrus was observed, transrectal real-time B-mode ultrasonography was performed twice daily (8:00 am and 4:00 pm) to monitor follicle development and determine time of ovulation. Mean VST and GST (± SEM) were reported and compared using MANOVA and Tukey-Kramer tests in SAS 9.1 (SAS Inc, Cary, North Carolina). Significant differences were reported at P < .05. Results: Evidence of ovulation was detected at approximately 38 ± 9 and 43 ± 12 hours after the onset of estrus in gilts and sows, respectively. Overall, daily VST and GST were significantly higher (P < .05) in sows than in gilts. During estrus, VST rose as estrus began and fell significantly (1.5°C; Implications: This study demonstrated that VST of sows and gilts, measured by IRT, changes significantly during estrus. The potential to use digital infrared thermography as an adjunct tool during estrus detection in swine appears to be promising. | ResumenObjetivo: Determinar, si durante el estro, ocurrieron cambios en la temperatura de la piel vulvar (VST por sus siglas en inglés), medida mediante termografía infrarroja (IRT por sus siglas en inglés). Materiales y métodos: Los grupos experimentales consistieron en 25 hembras primerizas y 27 multíparas. Dos veces al día (8:00 am y 4:00 pm) utilizando una cámara de imagen termal (Fluke IR FlexCam; Fluke Corporation, Everett, Washington), se midieron la temperatura de la piel del glúteo (GST por sus siglas e inglés) y la VST mediante tecnología infrarroja. Cuando se observó el estro, se realizó la ultrasonografía transrectal de tiempo real modo B, dos veces al día (8:00 am y 4:00 pm) para monitorear el desarrollo folicular y determinar el tiempo de ovulación. Se reportaron la GST (± SEM) y la VST promedio y se compararon utilizando las pruebas Tukey-Kramer y MANOVA en SAS 9.1 (SAS Inc, Cary, North Carolina). Se reportaron diferencias significativas en P < .05. Resultados: Se detectó evidencia de ovulación aproximadamente a las 38 ± 9 y 43 ± 12 horas después del inicio del estro en primerizas y hembras, respectivamente. En general, la VST y la GST diarias fueron significativamente más altas (P < .05) en hembras que en primerizas. Durante el estro, se detectó un marcado cambio en la VST promedio (1.5ºC; P < .05) 36 a 12 horas antes de la ovulación tanto en hembras como en primerizas. No hubo diferencia significativa entre las medidas de GST diarias (P > .05), pero la diferencia entre VST y GST si fue significativa (P < .01) a traves del tiempo. Implicaciones: Este estudio demostró que la VST de las hembras y primerizas, medido con IRT, cambia significativamente durante el estro. El potencial para utilizar la termografía infrarroja digital como una herramienta adjunta durante la detección del estro en cerdos parece ser prometedora. | ResuméObjectif: Déterminer si des changements de température cutanée vulvaire (VST) mesurés par thermographie à infrarouge (IRT) se produisent durant l’œstrus. Matériels et méthodes: Les groupes expérimentaux étaient constitués de 25 cochettes et 27 truies multipares. La VST mesurée par infrarouge et la température cutanée glutéale (GST) ont été mesurées deux fois par jour (8h00 et 16h00) à l’aide d’une caméra à imagerie thermique (Fluke IR FlexCam; Fluke Corporation, Everett, Washington). Une fois le réflexe d’immobilité observé, une échographie mode-B en temps réel effectuée par voie transrectale a été faite deux fois par jour (8h00 et 16h00) afin de suivre le développement folliculaire et déterminer le moment de l’ovulation. Les VST et GST moyennes ont été rapportées et comparées dans SAS 9.1 (SAS Inc, Cary, North Carolina) par MANOVA et test de Tukey-Kramer. Des différences significatives ont été rapportées pour P < .05. Résultats: Des évidences d’ovulation ont été détectées approximativement 38 ± 9 et 43 ± 12 heures après le début de l’œstrus chez les cochettes et les truies, respectivement. Dans l’ensemble, les VST et GST quotidiennes étaient significativement plus élevées (P < .05) chez les truies que chez les cochettes. Durant l’œstrus, un changement marqué dans la VST moyenne (1.5ºC; P < .05) a été détectée 36 à 12 h avant l’ovulation chez les truies et les cochettes. Il n’y avait aucune différence significative entre les mesures quotidiennes de GST P > .05, mais la différence dans le temps entre la VST et a GST était significative (P < .01). Implications: Cette étude démontre que la VST des truies et des cochettes, mesurées par IRT, change de manière significative durant l’œstrus. L’utilisation potentielle de la thermographie digitale à infrarouge comme outil complémentaire pour la détection de l’œstrus chez les porcs semble prometteuse. |
Keywords: swine, vulva, temperature, infrared thermography, estrus
Search the AASV web site
for pages with similar keywords.
Received: July 28, 2010
Accepted: November 10, 2010
Accurate estrus detection is an essential component of a successful breeding program in modern swine operations. It is labor intensive, time consuming, and an economically important aspect of the production system. Over the last 20 to 30 years, swine production systems have changed: there are fewer farms, with these farms holding larger numbers of breeding females. Along with this restructuring in the swine industry, application of techniques to improve reproductive efficiency and controlled breeding has occurred.1 Some of the assisted reproductive techniques now commonly utilized in modern swine operations include artificial insemination, hormonal induction of estrus in gilts, estrus synchronization of sows and gilts, and B-mode ultrasonography.2-5 Even with the addition of all of these technologies, prediction of ovulation is limited to a range of hours and is still considered a challenge for the swine industry.
Behavioral and physical signs of estrus are commonly used by the detector (boar or man) to determine the best time to inseminate female pigs.6 Vulvar reddening and swelling during estrus has been related to an increase in estrogen level, which stimulates blood flow to the reproductive tract and associated genital organs.6 Vulvar reddening is a secondary sign of estrus and should be used in conjunction with other signs to confirm estrus. The increase in blood flow increases the skin temperature of the vulva during estrus. To the authors’ knowledge, there are no published studies in swine using vulvar skin temperature (VST) as an indicator of estrus or ovulation.
Therefore, the objective of the current investigation was to explore the use of infrared thermography (IRT) of the vulva in gilts and sows to detect measureable temperature changes related to ovulation.
Materials and methods
All activities of this experiment were reviewed and approved by the Institutional Animal Care and Use Committee at the University of Illinois.
Animals and housing
The experimental group consisted of a total of 25 gilts and 27 multiparous sows. All Yorkshire × Landrace females were housed individually in a temperature- and humidity-controlled environment.
Estrous synchronization
The estrous cycle of the gilts was synchronized using an altrenogest solution (Matrix; Intervet/Schering-Plough Animal Health, Millsboro, Delaware), administered at a dosage of 15 mg (6.8 mL) to each female daily for 14 days. On the last day of altrenogest treatment, 5 mL of PG600 (Intervet/Schering-Plough Animal Health) was administered, providing 400 IU pregnant mare serum gonadotropin and 200 IU human chorionic gonadotropin. Day 0 of the experiment was the day of PG600 treatment for the gilt group and the day of weaning for the sow group.
Controls
The control group consisted of 30 pregnant sows (diagnosed pregnant by ultrasonography) at approximately 60 days of gestation on the day VST was measured. These sows were imaged with an infrared thermal imaging camera (Fluke IR FlexCam Thermal Imager, model Ti55; Fluke Corporation, Everett, Washington) in order to establish a normal VST for animals not undergoing hormonal changes associated with the estrous cycle.
Infrared thermography
Infrared thermography VST and GST were measured in the experimental groups at 8:00 am and 4:00 pm daily using the infrared thermal imaging camera before onset of signs of estrus in order to establish a baseline temperature for the female. Digital thermal imaging continued through estrus and until the female was detected as having ovulated and no longer showing signs of estrus. Digital thermal imaging was performed with the females in gestation crates before moving them to the boar for estrus detection. Images were acquired while the females were being fed, facilitating the procedure by having them up and standing still.
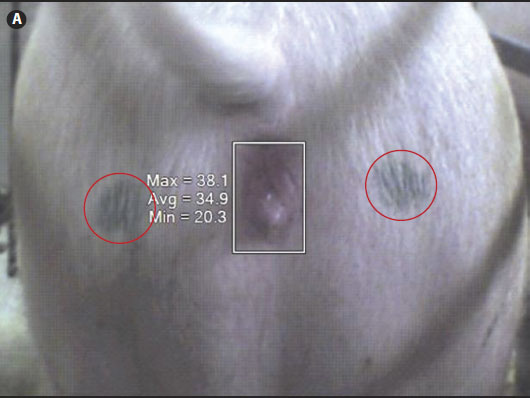
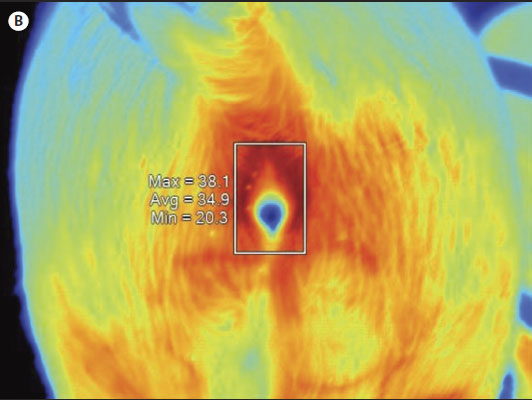
For IRT imaging, each sow or gilt was monitored from a fixed distance of 0.61 m, measured from the caudal end of the female. The monitoring itself focused on the gluteal region of the sow’s or gilt’s body, which included the anal and vulvar areas (Figure 1). A black spot was marked on each gluteal region of the female (Figure 1A) with the aim of taking measurements at the same location during each imaging event. Wiping or scrubbing of this caudal area with a dry paper towel was performed only if the area was excessively wet or dirty or both, so as not to disturb the skin temperature.
Figure 1: Digital infrared thermal image of a sow’s gluteal area with the vulva selected using SmartView Version 1.7 image analysis software (Fluke Thermography, Plymouth, Minnesota). A: White-light image. Black spots on the gluteal region (outlined by red circles) were used as guides. B: Infrared thermal image. All digital images were taken using the Fluke IR FlexCam (Fluke Corporation, Everett, Washington). Maximum (Max), average (Avg), and minimum (Min) temperatures (°C) of the vulvar skin are listed to the left of the rectangle outlining the vulvar area.   |
The digital infrared thermal images were downloaded into a computer and visualized using the SmartView Version 1.7 image analysis software (Fluke Thermography, Plymouth, Minnesota). This software allows the user to display the temperature at any given location (pixel) on the image. Additionally, specific areas such as the vulva can be outlined and the average, minimum, and maximum temperature values calculated (Figure 1). When the infrared images were analyzed, average temperatures of the gluteal areas were also calculated by the software and recorded.
Beginning on Day 2, estrus detection was performed immediately after imaging with the aid of an adult boar. Once standing estrus was observed, transrectal real-time B-mode ultrasonography (RTU) was performed twice daily (8:00 am and 4:00 pm) to determine the occurrence of ovulation. Ovulation was determined to be complete when fewer than four follicles ≤ 6.5 mm in diameter remained on the ovaries and corpora hemorrhagica were observed. Ovaries were visualized using an Aloka 500V ultrasonics machine (Aloka Inc, Tokyo, Japan) fitted with a transrectal 7.5-MHz linear transducer which was fitted into a rigid, fixed-angle PVC adapter described by Knox and Althouse.7
Statistical analysis
All mean values for VST and GST are reported as mean ± standard error (SE). The daily VSTs and GSTs of gilts and sows during estrus were compared within and between treatment groups using a MANOVA with repeated measures in SAS (SAS Institute Inc, Cary, North Carolina) to test the significance of putative temperature spikes. When differences were noted, a Tukey-Kramer test was performed. Means of GST and VST were compared for gilts and sows using a Student t test. A significant value was reported at P < .05.
Results
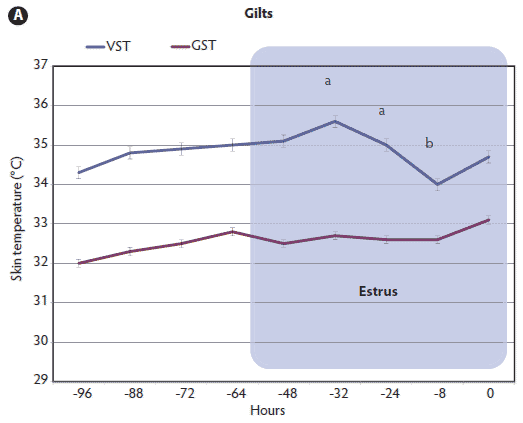
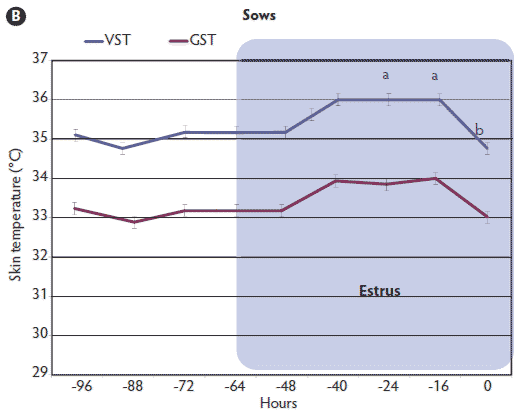
Evidence of ovulation was detected at approximately 38 ± 9 hours after onset of estrus in gilts and 43 ± 12 hours in sows. The daily mean VST of sows during estrus was significantly higher (P < .01) than that of gilts. During estrus, the mean VST of gilts reached a peak of 35.6°C ± 1.6°C and then, 8 hours prior to ovulation, decreased significantly (P < .001) to 33.9°C ± 1.7°C. This marked change in mean VST was detected between 32 and 8 hours prior to ovulation (Figure 2A). There was a similar trend in sows, with a peak VST of 36.1°C ± 1.3°C at 32 to 24 hours prior to ovulation and then, 16 hours prior to ovulation, a significant decrease (P < .001) to 34.6°C ± 1.6°C (Figure 2B). In graphs of individual females’ estrous cycles (data not shown), the majority (19 of 25 gilts and 23 of 27 sows) followed this pattern of reaching a peak VST and then decreasing precipitously prior to ovulation. An increase in VST was observed in 21 of 25 gilts and in all 27 sows. In the four gilts that did not show an increase in VST, standing estrus lasted 12 to 24 hours. Of the four sows that did not follow the same pattern of a rise and then precipitous fall in VST, two sows were in estrus 24 to 36 hours, and the other two displayed prolonged standing estrus behavior (> 48 hours). The GSTs remained relatively steady during the measurement periods, with mean values of 32.8°C ± 0.24°C and 33.5°C ± 0.24°C for gilts and sows, respectively (P > .05). Mean GST differed significantly from mean VST over time in both gilts and sows (P < .01; Student t test).
Figure 2: Vulvar skin temperatures (VST) and gluteal skin temperatures (GST) of 25 gilts (A) and 27 sows (B) during the periovulatory period as measured by infrared digital thermography. Time of ovulation (0 hours) was determined by B-mode ultrasonography. Values with different letters (a, b) are significantly different (P < .05; MANOVA with repeated measures and Tukey-Kramer test). Mean GST did not differ over time in either gilts or sows (P > .05; MANOVA). Mean GST differed significantly from mean VST over time in both gilts and sows (P < .01; Student t test).   |
Discussion
In this study, thermographic imaging was able to detect a rise and subsequent fall in VST several hours prior to ovulation. Gluteal skin temperature showed that the whole-body temperature of the animal remained relatively constant. Detection of change in temperature of the vulvar tissue by infrared thermography might be useful for predicting time of ovulation when used with conventional methods, eg, use of a boar for estrus detection. To the knowledge of the authors, no published studies have involved use of infrared thermography as an aid to estrus detection and as an ovulation predictor.
The increase in vulvar skin temperature was observed in 21 of 25 gilts and in all 27 sows. In the four gilts that did not follow the pattern described in the results, standing estrus was shorter than that in the sows, and therefore an increase in vulvar temperature might have been missed due to the timing of the measurements. A short estrus was also observed in two sows and a prolonged estrus in two other sows, and in these four sows, the time between the rise in vulvar temperature and ovulation was longer than for the majority of the group.
Junge-Wentrup and Holtz8 attempted to relate body temperature to estrus using temperature probes anchored deep inside the sow’s vagina. They concluded that vaginal temperature decreased 2 days before onset of estrus and then rose, reaching a maximum 2 days after standing estrus, close to the time of ovulation, and so could be a useful tool for prediction of ovulation. These results agree with the findings of the present study, although Junge-Wentrup and Holtz8 did not evaluate females for the incidence of ovulation.
As the estrus period approaches, plasma estrogen rises, causes vasodilation, and increases blood flow to the uterus and associated structures of the reproductive tract in the different species.9-12 Inspection of the female’s genitalia and adjacent tissues reveals obvious cyclic changes, which are undoubtedly vascular in origin. On the basis of our results and the timing of the rise in temperature, we speculate that the increase in VST was due to the elevation of estrogen levels during estrus. Elevated levels of estrogen are responsible for vascular changes, such as increase in blood flow, that occur in the vaginal and vulvar tissues, causing an increase in VST during estrus. When ovulation occurs and the estrus period ends, VST returns to normal.
This study demonstrated that VSTs of sows and gilts measured by digital infrared thermography change significantly during the periovulatory period. Additionally, there are distinct times that VST rises and then falls precipitously in sows as well as gilts, although the timing is slightly different in gilts and sows.
The potential for use of digital infrared thermography as a tool to study consecutive estrous cycles of individual females and as a predictor for ovulation appears promising. As the price of digital infrared cameras continue to decrease, this technology may be used in conjunction with conventional estrus detection. Future studies will compare the accuracies of high-end infrared thermocameras and inexpensive handheld units that do not visualize the pixels associated with the heat pattern.
Implications
• Infrared thermography may be a promising tool to evaluate VST of sows and gilts during the estrus period.
• Specific rising and falling of VSTs associated with detectable events in the estrous cycle may be used to develop prediction models to study ovulation of swine.
• Further research needs to be performed to determine the usefulness of this tool to assist producers in determining the proper timing for insemination.
Acknowledgements
The authors would like to thank Dian Canaday, Glenn Bressner, Doug Franklin, Chris Starkey, and Jonathon Mosley for technical support and assistance with the animals.
References
1. Rasbech NO. The male and fertility of domestic animals (AI or natural mating). In: Courot M, ed. The Male in Farm Animal Reproduction. Dordrecht, The Netherlands: Martinus Nijhoff Publishers; 1984:2–24.
2. Almond GW, Dial GD. Pregnancy diagnosis in swine: principles, applications, and accuracy of available techniques. JAVMA. 1987;191:858–870.
*3. Crabo BG, Dial GD. Artificial insemination in swine. Vet Clin N Amer: Food Anim Pract. 1992;8:533–544.
*4. Pressing AL. Pharmacologic control of swine reproduction. Vet Clin N Amer: Food Animal Practice. 1992;8:707–725.
*5. Britt JH. Manipulation of the porcine estrous cycle. Proc Soc Therio. 1996; 83–86.
6. Rojkittikhun T, Einarsson S, Edqvist LE, Uvnäs-Moberg K, Lundeheim N. Relationship between lactation-associated body weight loss, levels of metabolic and reproductive hormones and weaning-to-oestrous interval in primiparous sows. Zentralbl Veterinarmed A. 1992;39:426–432.
7. Knox RV, Althouse GC. Visualizing the reproductive tract of the female pig using real-time ultrasonography. J Swine Health Prod. 1999;7:207–215.
8. Junge-Wentrup S, Holtz W. Body temperature as a means to monitor reproductive functions in sows and cows. 10th Int Congr Anim Reprod Artif Insem. Vol 2. Brief Communications. University of Illinois at Urbana-Champaign, Illinois; 1984;141.
9. Bell DR, Rensberger HJ, Koritnik DR, Koshy A. Oestrogen pretreatment directly potentiates endothelium-dependent vasorelaxation of porcine coronary arteries. Am J Physiol. 1995;268:377–383.
10. Naderali EK, Walker AB, Doyle P, Williams G. Comparable vasorelaxant effects of 17α- and 17β-oestradiol on rat mesenteric resistance arteries: an action independent of the oestrous receptors. Clin Sci. 1999;97:649–655.
11. Sprague BJ, Phernetton TM, Magness RR, Chesler NC. The effects of the ovarian cycle and pregnancy on uterine vascular impedance and uterine artery mechanics. Eur J Obstet Gynecol Reprod Biol. 2009;144 (suppl):S170–178.
12. Abrams RM, Caton D, Bazer FW. Effect of estrogen on vaginal blood flow in ewes. Amer J Obstet Gynecol. 1972;113:681–685.
* Non-refereed references.