Practice tip |
Non refereed |
Aids to data management on swine production units
Duane Long, DVM
Dr Duane C. Long, 1878 East St Rd 16, Denver IN 46926; E-mail: longfam2@juno.com
Cite as: Long DC. Aids to data management on swine production units. J Swine Health Prod. 2004;12(2):85-86.
In swine facilities of all sizes and at all stages of production, producers are challenged with assimilating and interpreting many different pieces of information. Production data that is collected but never processed, analyzed, or interpreted is of limited value. Veterinarians often have access to this data and therefore have an opportunity to organize, interpret, and make recommendations on the basis of their discoveries. Spreadsheets and databases may be useful technology tools to aid the practitioner in data management. Following are three applications that veterinarians and producers may find useful.
Production projections
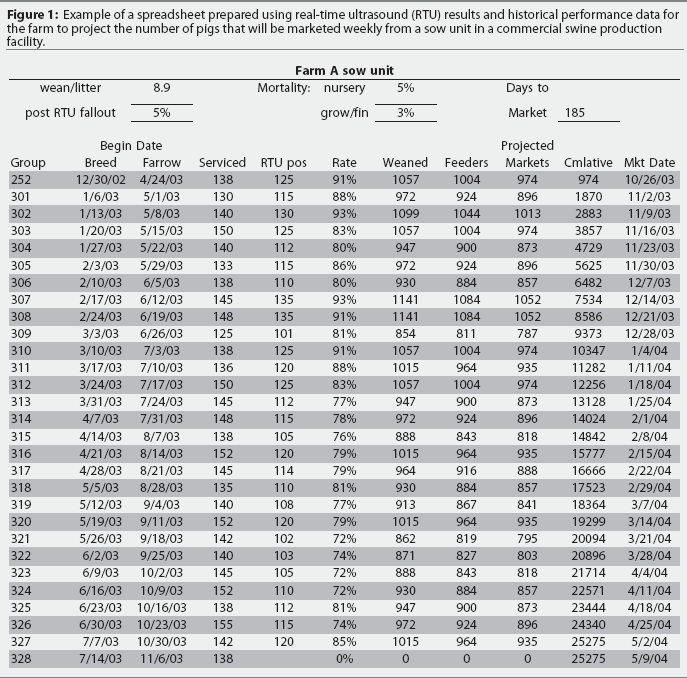
A simple spreadsheet may be useful to project the number of pigs that will be produced from a sow unit (Figure 1). Real-time ultrasound (RTU) data is included to make the number of anticipated farrowings more accurate. Production variables, such as pigs weaned per sow farrowed, nursery and finisher mortality, and days to market, may be adjusted to historical performance for the farm. Producers of weaned pigs, feeder pigs, or market pigs can see at a glance what their anticipated flows will be for the coming months. Gilt needs may be calculated and purchases made well in advance of the day when they are needed to be eligible for mating. The cumulative column is useful to see whether production goals are likely to be met.

Serology graphs
Producers want to know which swine diseases their pigs have and when the pigs are becoming infected. Practitioners commonly sample a few pigs from various age groups in an attempt to answer that question. Serologic data is entered into a spreadsheet and automatically turned into an attractive and easy-to-read graph (Figure 2). The primary Y-axis for the bar graph tells us the proportion of pigs testing serologically positive to porcine reproductive and respiratory syndrome (PRRS) virus. The secondary Y-axis is the high-low-close graph, which shows the geometric mean of the PRRS ELISA sample-to-positive (S:P) ratios for each age group of pigs sampled, as well as variation of one SD from the mean. Most of us find pictures easier to interpret than tables of numbers, and this graph makes an excellent teaching tool. Graphs may be annotated with additional objects such as a text box ("pooled samples PCR-positive") that indicates that the 11-week-old pigs tested positive for PRRS virus by polymerase chain reaction (PCR). These graphs are saved and compared to graphs generated on subsequent investigations.

Diagnostic results database
Many veterinarians are flooded with diagnostic data that needs to be dealt with in a timely and organized fashion. For larger production systems, the number of diagnostic cases may become overwhelming, and disease diagnoses become pieces of paper in a file cabinet, with no clear way to identify trends or summarize findings. A database is a good method of dealing with this problem. Pertinent information may be efficiently entered into database tables from laboratory case reports. Once the information is entered, the dataset becomes a powerful tool that may be queried for answers to questions such as the following: in the past 3 months, which disease was diagnosed the most often; which grow-out site had the most case submissions; which sow farm source is generating the most cases of disease X; and at what age do most diagnostic cases occur? These questions are commonly discussed on conference calls, and if all participants have a report that summarizes diagnostic findings on just a few pages, this may help facilitate meaningful dialogue.
Developing data management systems
Entering data into databases and spreadsheets is time consuming and may be frustrating if the person doing data entry did not actually develop the spreadsheet template or database tables. Simple designs work best, as there is less opportunity for error, and errors may be more easily corrected. Developing these tools may be time consuming and frustrating as well. Always know what problem you are trying to solve before spending the time to develop a solution. Producers appreciate a helping hand with their information overload, and veterinarians may play a key role in solving these problems.