From the Editor
Thank you for responding to the readers’ survey
In October 2003, we sent a survey to all of you who have published your work in the Journal of Swine Health and Production during the last 2 years, and to a random sample of 175 readers. This note will summarize the readers’ responses. Surveys were sent to readers with e-mail addresses, selected at random from the 1379 members listed in the 2002 AASV Membership Directory and from the 2003 list of 93 paid journal subscribers. Approximately 12% of the AASV membership and subscribers were surveyed. In addition, surveys were sent to six of the 149 veterinary students in the 2003 AASV registry. Each person was reminded twice, at 3-week intervals, to respond to the survey. The purpose of the survey was to identify the strengths and weaknesses of the publication so that we can modify it to better serve you, our audience. Although our response rate was only moderate (45%), we hope that the responses are reflective of the whole.
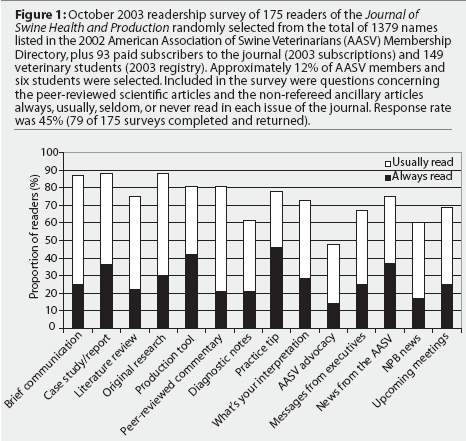
 Most sections of the journal are either always or usually read (Figure 1). New
scientific information reflected in our
peer-reviewed articles is commonly read by 81 to 88%
of the readers. The percent of people reading Brief Communications has jumped
from 66% in 19991 to 87% today.
Literature reviews are read by 75% of people, but many readers said they used the journal
as a reference library, perhaps implying that this information may be referred to on
an as-needed basis. Most readers (90%) believe that the level of science is
appropriate for this journal. Respondents appreciated the
balance between pure research and practical on-farm research. One person
suggested that the applied papers reflected
American but not European production practices. In general, the readers applauded the
review process and encouraged us to insist on appropriate statistical design and
analysis. Finally, there was a recommendation to
provide short explanations for laboratory tests such as polymerase chain reaction
and western blot.
The ancillary sections, that are not peer-reviewed, are read by 62 to 78% of people. Since 1999,1 the proportion who read the messages from the executives has risen from 45% to 67%. Perhaps we have Dr Lisa Tokach to thank for that! The AASV news, Advocacy in action, and other news items are routinely read by 48 to 75% of the subscribers. Although these serve a function for the members of the AASV, we are aware that the portion of the journal dedicated to these topics should not exceed their currently allotted space.
The readers felt that the tables and figures were either always (76%) or mostly (20%) easy to understand. They appreciated having the tables or figures on the same pages as the text that referred to them. Some readers found graphs difficult to understand when they were not in color. Most readers (85%) felt that the balance between tables and figures was appropriate; however, views were dichotomous. One reader recommended that results be provided in both table and figure format. Another reader said that figures are not useful because he or she wanted to see the actual numbers, not the percentages that were provided in the figures. Finally, someone suggested that each figure should have actual numbers provided on the bars and for deviation, percent, and significance.
We wondered if the font and three-column layout made the journal easy to read. Most people (88%) found the text easy to read. Although most readers said the font size was appropriate, one asked that we increase the font size by one unit and another said there was too much data on one page. One suggestion was to increase the font size for the on-line version of the journal. When we asked if the journal had sufficient color, the answers were variable: 67% thought it was sufficient; 4%, somewhat sufficient; 23% thought it was insufficient; and five people thought it was not important or they were not sure. The responses ranged from "more color is always better" to "the use of color should be judicious because this is a scientific journal." One person wrote "more color is always better, but if you made me pay for it, I wouldn’t add more." I thought that summed up the sentiment quite well.
I really appreciate the time each of you took to respond to the survey. In general, it appears that you are happy with the journal, but there are certain areas that may be improved. That is exactly the information we were hoping to glean from the survey. The staff will discuss what changes can be made to accommodate your suggestions.
–Cate Dewey
Reference
1. Dewey CE. From the Editor. Swine Health Prod. 2000;8:49.