What’s your interpretation? | Non refereed |
| The rate of returns to service in a 500-sow herd was 33% between April and October. What conclusions can be drawn about the time intervals of the repeat services? Is this problem due to disease or a management problem? | 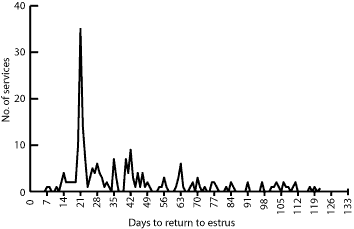 |
Management too good to be true
David Nolan, DVM
Cargill Pork, PO Box 699, Russellville, AR 72811; Tel: 479-968-4560; Fax: 479-968-5902; E-mail: david_nolan@cargill.com.
Nolan D. Management too good to be true. J Swine Health Prod. 2003;11(2):106-107.
This herd had experienced a high rate of repeat services (33%) all summer, with a recent sharp decline in pigs born alive. There were also several early term abortions. During the same time period, the farrowing rate was 55%, the wean-to-service interval was 6.4 days, the number of piglets born alive per litter was 9.4, and the number of matings per service was 1.95.
Figure 1 shows that there are too many returns to service for a 500-sow herd, and the pattern of returns initially indicates that the majority are "normal" (falling in the 18- to 24-day post-insemination window). The normal pattern tends to rule out common infectious causes. When the pattern of returns appears normal, the rule-out list usually includes the problems listed in Table 1.
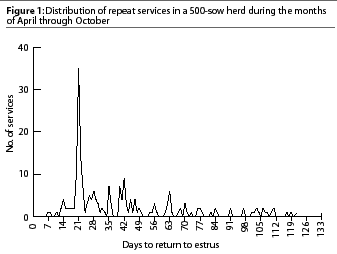
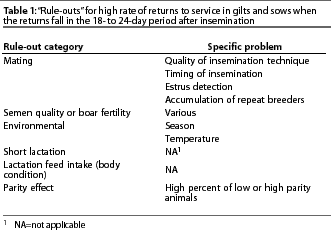
The herd’s production consultant had already identified a normal pattern of recycles and was concerned that estrus detection may have been the cause of the problem. After working with the farm manager in the breeding barn for several days, the consultant was convinced that the producer was able to detect heat and inseminate the sows properly. Upon further inspection, it was noted that there was very little variation around the 21-day mark, especially for a farm with a 33% repeat rate during the summer months. This raised more questions and further analysis was performed.
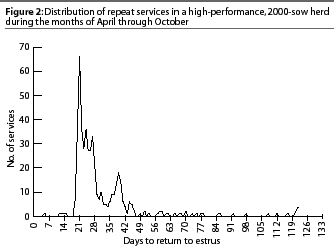
Figure 2 represents a return analysis from a high performance herd in the same system during the same time frame. Note that in the high performance herd, there is a higher percentage of "abnormal" returns, although the overall number of returns is much lower. In contrast, the pattern in Figure 1 shows very little variation in the length of returns around the 21-day mark. This may indicate that animals are being heat checked only at 21 days of gestation.
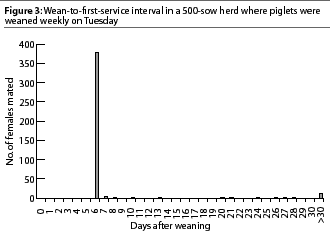
The next analysis that was done was the wean-to-service interval for the same time period. Figure 3 is worth a thousand words. When this graph came off the printer, it became obvious what the problem was. The herd weans once per week, on Tuesday. The producer had been taking the weekends off and was mating 93% of the sows on day 6 post weaning. The 6.4-day return-to-service interval was increased by 1.0 day compared to the previous 6-month time frame, when the producer did not take the weekend off. To make matters worse, 94% of these animals were inseminated twice. The first insemination was very late in the estrus cycle, assuming the animals were still in estrus at all. Also, in this case, trying to make up for lost time by forcing the second insemination likely did much more harm than good. The first of these animals were farrowing with 1.5 fewer pigs born alive per litter compared to litters in the same facility 6 months earlier, and 2.0 fewer pigs than the average for other herds in this system. The repeats were concentrated on day 21, because Monday was the day that the sows were rechecked. The repeats other than day 21 were almost entirely gilts.
This problem was directly related to improper management practices and poor timing of insemination. Although it appeared that the right things were being done when the farm was visited on a weekday, the weekends were clearly a different story. In this instance, because the records were better than expected, further investigation was possible. As with any investigation, even when the answer appears to be obvious, keep digging. Look not only for what’s "broke," but also for what is "too good to be true."