Practice tip: Real time ultrasound
Practice tip |
Non refereed |
Real time ultrasound
Max Rodibaugh, DVM
Swine Health Services, LLC, Frankfort, Indiana; E-mail: pigvet@iquest.net.
Rodibaugh M. Real time ultrasound. J Swine Health Prod. 2002;10(5):227.
Real time ultrasound (RTU) has stimulated new interest and confidence in pregnancy detection. The following are a couple of ideas related to use of RTU in practice.
Free RTU gel
Ever wonder what to do with all those extra cold packs? Put them to good use by cutting a corner off the packs, filling dispenser bottles with the content, and using this for RTU "gel". It’s not really gel, it’s a little messy, and it doesn’t stick as well as the gel you purchase, but it results in a good image and it’s free and always available – unless your cold packs are frozen!
Using RTU results with spreadsheets for calculating "fallout"
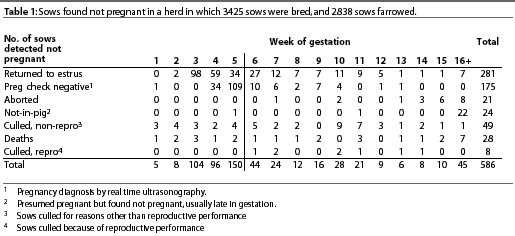
Now, for a more technical note: use your RTU data to your advantage. Determine average "fallout" after RTU pregnancy checking in your client herds. This can be done with spreadsheets that monitor results so that you can develop a history for each farm. If you want to look back at data that has already been entered in PigCHAMP (Swine Data Management, Wheatland, IA 52777), run the farrowing rate report for a period where farrowing data is complete. Include the counts and reasons reports. Get total services from the counts report, go to the reasons report, and draw a line at 5 weeks or where the bulk of the negative pregnancy check results are to the left of the line. Total the number of open females to the left of your line, subtract from total services, and this should be the number of females still expected to be pregnant after RTU. The counts farrowing rate report will give you the total number farrowed, so that you can then calculate the percent fallout after RTU. We like to see this in the 3 to 5% range, but it will vary with herd and season (more in summer) and will depend upon the stage at which RTU is done. The reasons report will also indicate where the fallout has been, eg, deaths or abortions.
We prefer not to enter positive RTU results due to the effects on some of the PigCHAMP reports. Once you know average fallout for herds, this number can be used in herd-specific prediction models for the number of sows that will farrow.
Table 1 shows an example of the fallout calculation using data from PigChamp reports in a herd in which 3425 sows were serviced. At 5 weeks, a total of 363 sows were open (5 + 8 + 104 + 96 + 150). It was expected that 3062 sows (3425 – 363) would be pregnant after RTU. However, only 2838 sows farrowed, so the fallout after RTU in this herd was 224 sows (3062 – 2838) or 7.3%.
