What’s your interpretation – July 2002
What’s your interpretation?
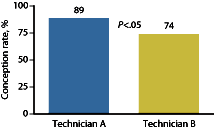
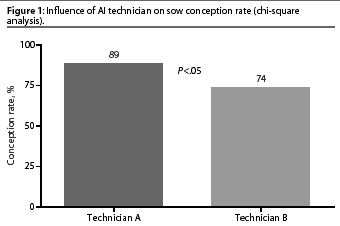
 | This figure shows a significant difference in sow conception rate for two AI technicians, A and B (chi-square analysis). What factors, other than technician skills, may have contributed to this difference? |
An example of a hidden factor in observational data
With the advent of low-cost com-puting power and widespread implementation of data bases, evaluation of observational or retrospective production data has become a common tool of swine veterinarians to aid in decision-making processes. Observational data has much strength, which includes eliciting risk factors or associations under actual field conditions and being relatively inexpensive to collect, and it may be the only data available. The whole science of statistical process control is devoted to developing guidelines for aiding the interpretation of observational data.
The major weakness of retrospective data is the possibility of hidden factors (confounding variables) that influence the response. A good example is interpretation of a dataset evaluating conception rate by two AI technicians. It appears that the conception rate is better for sows bred by Technician A than for those bred by Technician B (Figure 1). In fact, Technician A has a significantly better conception rate than Technician B (P < .05, chi-square analysis).

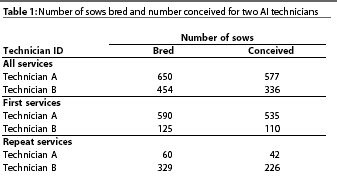
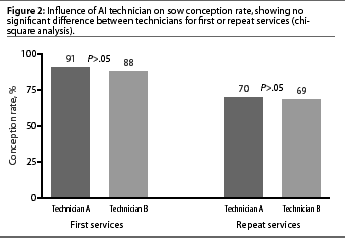
However, upon examining the data further (Table 1), we find that a much larger proportion of the services by Technician B were repeat services (329 repeat services for Technician B and 60 for Technician A, of a total of 389 repeat services). It is well known that conception rate is lower for repeat services.1 The fact that Technician B bred a much larger proportion of repeats is responsible for this technician’s lower conception rate. Thus, when conception rate is examined within either first services or repeat services, there is no significant different between technicians (Figure 2).


The confounding of conception rate for first and repeat services serves as a good example of a hidden factor that, in this case, could easily be misinterpreted as a difference in the skills of the technicians.
Reference
1. Leman AD. Optimizing farrowing rate and litter size and minimizing nonproductive sow days. Vet Clin N Am Food Anim.1992;8:609-622.
— Steve Dritz, DVM, PhD
Food Animal Health and
Management Center
Kansas State University
Manhattan, KS 66506