| Original research | Peer reviewed |
Cite as: Gruhot TR, Calderón Díaz JA, Baas TJ, et al. An economic analysis of sow retention in a United States breed-to-wean system. J Swine Health Prod. 2017;25(5):238–246.
Also available as a PDF.
SummaryObjectives: To determine the number of parities sows should be retained in a breed-to-wean system to maximize returns over total cost per weaned pig and net return on investment, and to assess the sensitivity of returns over total cost per weaned pig to feed price and number born alive (NBA). Materials and methods: Data used to estimate NBA and pre-weaning mortality by parity were collected between 2001 and 2014 at 17 Midwest US farms representing a total of 105,719 sows, accounting for 502,491 total records. Projected budgets were compared for various parity distribution scenarios using a “steady-state” farm model that included both variable and fixed costs associated with the farm and the proportion of sows by parity in the distribution. Results: The cost of producing a weaned pig was minimized by culling after parities 5 through 9, and culling after late parities (ie, parity 7 through 9) showed greater returns over culling after parities 1 through 4. Culling after parities 5 to 9 showed approximately a 15% net return on investment. When NBA increased, culling after parities 5 through 9 had the highest returns. Culling after parities 6 through 9 showed the greatest returns with low feed prices. With high feed prices, all parity distributions costs exceed returns, though culling after parities 5 and 6 came closest to breaking even. Implications: Retaining sows in the herd longer has economic benefits that could increase the financial returns of a breed-to-wean system. | ResumenObjetivos: Determinar el número de partos que las hembras deben ser retenidas en un sistema de cría a destete para maximizar el retorno sobre el costo total, por cerdo destetado, y el retorno neto a la inversión, así como valorar la sensibilidad del retorno sobre el costo total por cerdo destetado en base al precio del alimento y el número de nacidos vivos (NBA por sus siglas en inglés). Materiales y métodos: Se recolecto información utilizados para valorar el NBA y la mortalidad pre destete por parto entre 2001 y 2014 en 17 granjas del Medio Oeste de los EUA con un total de 105,719 hembras, contabilizando 502,491 registros totales. Se compararon los presupuestos proyectados en varios escenarios de distribución por paridad utilizando un modelo de granja en “estado constante” que incluyó los costos variables y fijos asociados con la granja y la proporción de hembras por paridad en la distribución. Resultados: El costo de producción de un cerdo destetado fue minimizado cuando se desechó después del parto 5 al 9, desechar después de los últimos partos (vg, parto 7 al 9) mostró mayor retorno sobre desechar después de los partos 1 al 4. Desechar después de los partos 5 al 9 mostró aproximadamente un 15% sobre el retorno neto a la inversión. Cuando el NBA aumentó, desechar después de los partos 5 al 9 presentó los retornos más altos. Desechar después de los partos 6 a 9 mostró los mayores retornos con precios de alimento bajos. Con precios de alimento altos, todos los costos en las diferentes distribuciones de paridad excedieron el retorno, aunque desechar después de los partos 5 y 6 se acercó al punto de equilibrio. Implicaciones: Retener a las hembras en el hato más tiempo tiene beneficios económicos que podrían incrementar los retornos financieros de un sistema de cría a destete. | ResuméObjectifs: Déterminer le nombre de parités pour lesquels des truies devraient être maintenues dans un système de production de type accouplement-sevrage afin de maximiser les retours sur le coût total par porc sevré et le retour net sur l’investissement, et d’évaluer la sensibilité des retours sur le coût total par porc sevré au prix de l’aliment et du nombre d’animaux nés vivants (ANV). Matériels et méthodes: Les données utilisées pour estimer l’ANV et la mortalité pré-sevrage par parité ont été accumulées entre 2001 et 2014 dans 17 fermes du Midwest Américain représentant un total de 105,719 truies et 502,491 dossiers. Les budgets prévus ont été comparés pour différents scénarios de distribution de parités en utilisant un modèle de ferme stable qui incluait autant des coûts variables que fixes associés à la ferme et à la proportion de truies par parité dans la distribution. Résultats: Le coût de produire un porcelet sevré était minimisé en réformant les truies après les parités 5 à 9, et une réforme suite à des parités tardives (ie, parités 7 à 9) a permis un retour plus élevé qu’une réforme après les parités 1 à 4. Une réforme après les parités 5 à 9 avait un retour net sur l’investissement d’environ 15%. Lorsque l’ANV augmentait, la réforme après les parités 5 à 9 donnait les retours les plus élevés. La réforme après les parités 6 à 9 montrait le plus grand retour avec des prix faibles des aliments. Avec des prix élevés des aliments, les coûts associés avec toutes les distributions de parités excédaient les retours, bien que la réforme après les parités 5 et 6 soient venues bien proche de faire leurs frais. Implications: La rétention plus longue des truies dans le troupeau avait des bénéfices économiques qui pourraient augmenter les retours monétaires dans un système de production de type accouplement-sevrage |
Keywords: swine, economic analysis, optimal parity distribution, sensitivity analysis, sow longevity
Search the AASV web site
for pages with similar keywords.
Received: August 16, 2016
Accepted: January 10, 2017
Higher parity sows wean heavier pigs and produce more pigs per year than females in lower parities.1-3 For these reasons it has been recommended that producers keep culling levels low to reduce the number of dams in first or second parity within a breeding herd, as the ability to produce and wean more pigs per year directly influences the profit capability of a farm.4
Sow retention rate drives optimal parity distribution (OPD), and the more productive parities should compose a greater proportion of sows in the herd parity distribution.5 It has been proposed that 52% of sows in a given herd should be in parities 3 through 6, as these are considered peak performance in the sow’s lifetime.6,7
A sow should not be replaced until the productivity and profit generated by the later-parity sow are less than those of a potential replacement gilt.4.8 Once a replacement gilt is introduced into the breeding herd to replace an older sow, the gain in genetic improvement will be recognized immediately, though allowing the sow to produce in the herd longer increases the profit level per animal.8 Furthermore, it has been reported8 that current replacement rates are not profitable if the reason for a system’s high replacement rate is to solely introduce new gilts at a higher percentage to keep up with gains in genetic improvement that are being observed at the multiplier and nucleus levels of production.
Dhuyvetter3 and Abell et al8 reported that maximum pigs weaned per sow per year are observed by allowing sows to remain in the breeding herd until their 8th parity, and Stevermer4 reported that sows as old as parities 8 through 10 out-perform sows in their first parity. A sow reaches a positive value for lifetime net income at parity 3.9,10 However, in the United States, the average culling parity is between 3.1 and 3.7,10 indicating that a sow barely covers her replacement cost at the time of removal. This represents a loss in profit potential by not retaining sows until later parities. If the cost of a replacement gilt can be spread over a greater number of pigs produced, such as the case when sows are retained longer, the cost to produce a market hog decreases.8
The objectives of this analysis were to assess a series of parity distributions to determine the number of parities for which a sow should be retained in a breed-to-wean system to maximize returns over total cost per weaned pig and net return on investment, and to assess the sensitivity of returns over total cost per weaned pig to feed price and number born alive (NBA).
Materials and methods
Animal care and use committee approval was not obtained for this study because the data used for this analysis were obtained from a single private company’s existing database.
Production data and data exclusion criteria
Data editing and categorization was conducted in R.11 Data were collected from 2001 to 2014 from 17 farms located in the Midwest region in the United States. Both purebred and crossbred sows were included in the dataset. Data editing was performed to ensure data were within normal physiological ranges and free from recording errors. Outlier records were removed, and any sow that did not have complete lifetime performance records was not included in the analysis. Individual records were considered outliers and removed from the data set if they were ± 3 standard deviations from the mean for the following traits at each parity: NBA, number of piglets weaned, total piglets born, number of stillborn piglets, wean-to-first-service interval, and weaning age. Records greater than parity 10 were removed due to the small number of records in those high parities. Approximately 4% of the total litter observations needed to be adjusted for piglets fostered due to recording errors in either NBA, fosters, or number weaned. These errors caused the recorded number of weaned pigs to be impractical on the basis of the given values for NBA and fostered. The values for NBA, fostered, and number weaned were needed in the calculation of pre-weaning mortality. The Shapiro test was used on the model residual information, as well as an examination of the normal plot to evaluate the dataset for normal distribution. The final data set included 502,491 records accounting for lifetime performance of 105,719 sows.
Estimation of number born alive and pre-weaning mortality from the production data
Statistical analyses were conducted using ASReml software. The first model was used to estimate pre-weaning mortality by parity. Fixed effects included parity, farm, year, breed, and piglet age at weaning. The random effect of sow was included to account for correlation among repeated dam records. Number born alive by parity was estimated using a second model. This model included fixed effects of parity, farm, year, breed, and wean-to-first-service interval. Random effects of sow and contemporary group (farm by year by season) were also included. The statistical method used to produce P values to evaluate statistical differences between estimates was a t test.
Value of animals
Price per weaned pig sold was calculated by using the composite weighted average price of a 4.5- to 5.5-kg weaned pig from the National Direct Delivered Feeder Pig Report.12 The weaned pig price used in the model ($36.90 per pig) was based on an average of weekly prices reported during the 2001-2014 period.12 The price paid for replacement gilts was calculated using the monthly negotiated Iowa/Minnesota Daily Direct Prior Day Hog Report (plant delivered) prices for 2001-2014.13 An average weight of 125 kg was used with a dressing percentage of 72%,14 which resulted in a value of $137.48 per head. An additional $85.00 per head was added for genetic premium,10,15 which resulted in the value of a replacement gilt being $222.48 per head. If breeding is not successful then gilts are culled. The cull-gilt price used assumed a weight of 129 kg at a price of $142.48 per head from 2001-2014.14 It was assumed that approximately 20% of purchased gilts do not conceive and are culled from the breeding herd under all scenarios.16,17 The cull-sow price was based on the Weekly National Direct Swine Report18 national weighted average price of negotiated sows weighing 136 to 227 kg from 2002-2014.18 Table 1 provides a listing of additional animal and production values.
Table 1: Market prices, production values, investment costs, and miscellaneous expenses used in the economic analysis of sow retention for a 5000-sow breed-to-wean operation (all prices, costs, and expenses in US$)
| Parameter | Value used in analysis |
|---|---|
| Market price | |
| Price for weaned pig ($/head)12 | 36.90 |
| Price for cull sow ($/45.4 kg)18 | 43.15 |
| Price for replacement gilts ($/head)14 | 222.48 |
| Production values | |
| Average age of weaning (days)19 | 21 |
| Average weaning weight (kg)19 | 5.9 |
| Litters/sow/year19 | 2.32 |
| Sow mortality (%)20 | 8.34 |
| Variable costs | |
| Soybean meal ($/ton)21 | 311.21 |
| Corn ($/0.04 m3)22 | 3.69 |
| Base mix: vitamins, minerals, etc ($/ton) | 677.00 |
| Feed processing ($/ton)23 | 9.09 |
| Utilities (fuel and oil) ($/weaned pig)24 | 1.22 |
| Building and equipment repairs (%)* | 2.00 |
| Legal/accounting fees ($/weaned pig)24 | 0.24 |
| Transport and marketing costs ($/weaned pig)24 | 1.00 |
| Labor, annual salary expenses ($)† | 34,000.00 |
| Veterinary, drugs, supplies ($/weaned pig)24 | 3.62 |
| Depreciation on breeding herd (%)‡ | Varied |
| Interest on breeding herd (%)25 | 7.19 |
| Semen charge per litter ($) | 12.00 |
| Fixed costs | |
| Interest on buildings and equipment (%)25 | 7.19 |
| Total building and equipment investment ($)§ | 4,775,811.00 |
* (Total building/equipment investment/pigs sold/year) × (2% assumed value).
† Average provided by a Midwest US swine company.
‡ Based on the cull and replacement rate of the parity distribution.
§ Calculation based on a 5000-sow herd (building, sow housing, equipment).
Model operation
The modeled enterprise was a 5000-sow breed-to-wean operation. This facility was assumed to individually house sows during gestation and lactation, as this represented the housing system used by the production company at the time the data were being recorded. The total number of sows (5000) and 2.32 litters per sow per year were held constant across all scenarios. Replacement rate was calculated as gilt purchases over the running inventory, per parity distribution. Death loss and culls due to failure to conceive were considered in the calculation of gilt purchases needed to maintain the breeding herd.
The budgets used in this analysis were developed by Dhuyvetter 3,16 and were used to demonstrate a breeding herd that culls sows after their first through 10th parities as a means to identify the optimal parity distribution on the basis of returns over total cost per weaned pig. Conception rates play a large role in OPD. For this analysis, gilt conception rate was slightly below 80%, while conception rate at all other parities was approximately 86%.16 Examples of the parity distribution scenarios include a system that culls sows after their first parity, resulting in a breeding herd comprising only gilts, whereas a system that culls sows after their fourth parity would be composed of dams through their fourth parity. Under current economic situations it is not likely that producers would maintain a breeding herd composed of only gilts. However, in operations that utilize a parity segregation system, a gilt-only herd would be applicable and was included for comparison purposes. A “steady-state” model was used to demonstrate returns on the basis of an existing farm versus a system that is just entering production. Feed cost sensitivity analysis, as well as increased sow production, was conducted as a part of the economic analysis. The budget analysis is presented on a per weaned-pig value basis.
Variable costs
Variability in feed consumption by parity was accounted for with a linear range for gestation diets of 2.5 to 2.7 kg per sow per day for parities 1 through 10 and a non-linear range for lactation intake of 4.6 to 5.7 kg per day per sow for parities 1 through 10.16 The assumption was made that no creep feed was provided prior to weaning. The corn and soybean meal prices used in the present study were an average of 48% higher than the prices used by Dhuyvetter.3 The price of base mix was calculated using this average percentage price increase, applied to the price of base mix used in formulating sow diets as described by Dhuyvetter.3 Semen cost per litter was assumed to be $4.00 per dose: this price was provided by the company supplying the production data. It was assumed that two semen doses per sow per litter are required, as well as an additional $4.00 charge per sow that farrowed, as a means to cover the expense of sows or gilts that were bred and did not conceive or farrow. The cost of insurance on the breeding herd was calculated as 1% of the total breeding herd investment divided by the number of weaned pigs sold per year.3 A complete variable costs breakdown can be found in Table 1.
Fixed costs
Total building and equipment investment costs accounted for the cost of gestation and farrowing stalls, cost per square meter of building, and the equipment required in the building, such as feeders and panels. A useful life of 20 years was assumed and applied to the building, and a 12-year useful life for equipment was assumed and used in the depreciation calculation.3,26 Insurance on buildings and equipment was an assumed value of 1%. A 10% salvage value was applied to buildings, while a 0% salvage value was applied to all equipment and stalls.3 The fixed costs used in this analysis can be found in Table 1.
Sensitivity analysis
Number born alive estimates were averaged over parity groups 1 to 3, 4 to 6, and 7 to 9, as well as year groups 2001 to 2005, 2006 to 2010, and 2011 to 2014. These estimates were used as a means to show how NBA has changed since 2001 across parities. As years 2011 to 2014 were shown to be the most prolific years for sows, records from those years were analyzed using the original NBA and pre-weaning mortality models previously described. The estimates were then used in the budget analysis to assess how greater NBA and pre-weaning mortality affect the recommended parity distribution with all other inputs held constant.
Feed price was assessed in the sensitivity analysis. The two lowest costs for corn and soybean meal over the 14 years were selected, averaged, and then used as the new value for both inputs. This was repeated with the two highest prices for corn and soybean meal. All other factors were held constant.
Results
Figure 1 presents the NBA and pre-weaning mortality estimates by parity that were used as inputs in the economic analysis. Number of piglets born alive was shown to be highest in third-parity sows. An increase in NBA was observed until parity 3, which then steadily decreased until parity 10. Additionally, NBA differed among parities (P < .05). Pre-weaning mortality estimates also differed among parities (P < .05) except parity 9, which showed a trend toward significant differences with other parities (P < .10), and parity 10, which showed a tendency that appears different from other parities (P < .25). Average number weaned per birth litter, on the basis of the given parity distribution, is presented in Table 2. Across all parity distributions, an average of 9.65 pigs were weaned per litter on the basis of the given parity distribution.
Figure 1: Pigs born alive per litter and pre-weaning mortality (least squares means ± standard error) used in an economic analysis of sow retention in a breed-to-wean system, estimates by parity, for parities 1 through 10 from 105,719 sows. Values gathered from 2001-2014. *A significant difference was observed between parities for pigs born alive per litter (P < .05; t test).† A significant difference was observed between parities for pre-wean mortality (P < .05; t test) except parity 9, which showed a trend toward significant differences with other parities (P = .09), and parity 10, which showed a tendency that appears different from other parities (P = .25).
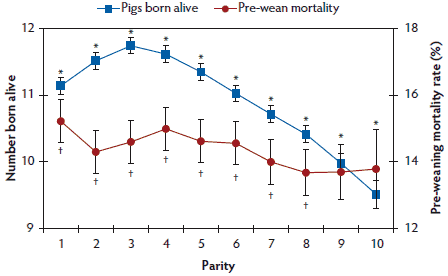
Table 2: Production values, inputs, and results from the economic analysis of sow retention of a 5000-sow breed-to-wean operation*
| Parity prior to cull† | ||||||||||
|---|---|---|---|---|---|---|---|---|---|---|
| 1 | 2 | 3 | 4 | 5 | 6 | 7 | 8 | 9 | 10 | |
| Ave parity‡ | 1.00 | 1.46 | 1.90 | 2.32 | 2.70 | 3.07 | 3.40 | 3.76 | 4.05 | 4.32 |
| Ave removal parity§ | 1.00 | 1.86 | 2.62 | 3.26 | 3.79 | 4.29 | 4.68 | 5.08 | 5.41 | 5.64 |
| Sow inventory | 5000 | 5000 | 5000 | 5000 | 5000 | 5000 | 5000 | 5000 | 5000 | 5000 |
| Replacement rate (%) | 295 | 158 | 113 | 90 | 78 | 69 | 63 | 58 | 54 | 53 |
| Annual purchases | 14,764 | 7909 | 5642 | 4508 | 3902 | 3445 | 3164 | 2918 | 2723 | 2636 |
| Total litters/year | 11,600 | 11,600 | 11,600 | 11,600 | 11,600 | 11,600 | 11,600 | 11,600 | 11,600 | 11,600 |
| Litters/sow/year | 2.32 | 2.32 | 2.32 | 2.32 | 2.32 | 2.32 | 2.32 | 2.32 | 2.32 | 2.32 |
| Born alive/litter | 11.14 | 11.31 | 11.44 | 11.47 | 11.45 | 11.41 | 11.35 | 11.28 | 11.21 | 11.13 |
| Pigs weaned/litter | 9.44 | 9.64 | 9.75 | 9.78 | 9.76 | 9.72 | 9.68 | 9.63 | 9.57 | 9.51 |
| Weaned pigs produced/week | 2106 | 2150 | 2175 | 2180 | 2177 | 2169 | 2159 | 2147 | 2135 | 2121 |
| Pigs sold/sow/year | 21.91 | 22.37 | 22.62 | 22.68 | 22.65 | 22.56 | 22.46 | 22.34 | 22.21 | 22.06 |
| Pigs sold/year | 109,559 | 111,829 | 113,115 | 113,391 | 113,237 | 112,808 | 112,299 | 111,695 | 111,052 | 110,319 |
* Values gathered from 2001 to 2014.
† Represents the parity distribution based on sow culling strategy. For example, “4” indicates that in the parity distribution scenario sows are kept until parity 4 and then culled. Sows bred but do not conceive, or that do not show signs of estrus prior to the final parity in the distribution, are culled.
‡ Average (Ave) parity: weighted average of sows farrowing within each parity of the given parity distribution scenario.
§ Ave parity of removal: weighted average removal parity of sow culls and deaths at each parity of the given parity distribution scenario. Gilts culled prior to having a litter are not included in this value.
The number of replacement females needed to maintain 5000 breeding animals is shown in Table 2, with the associated replacement rate for each parity distribution. As sows are retained longer and culled later in life, the replacement rate decreases.
The parity distribution where culling occurs after parity 1 sells fewer weaned pigs per year than any other scenario, as shown in Table 2. The parity distribution that sells the most weaned pigs per year is the scenario that culls sows after their fourth parity (Table 2). Though culling after parity 4 was shown to produce the most saleable weaned pigs, this is not the parity distribution that most minimized the cost per weaned pig, as this is dependent on additional factors such as the variable costs represented in Table 3. The parity distribution that most cost effectively produced weaned pigs, and had the greatest return over total cost, was culling after parity 6 (Table 3).
Table 3: Budget analysis and net return on investment of sow retention in a 5000-sow breed-to-wean operation on a per weaned-pig basis (all prices, costs, and expenses in US$)*
| Parity prior to cull† | ||||||||||
|---|---|---|---|---|---|---|---|---|---|---|
| 1 | 2 | 3 | 4 | 5 | 6 | 7 | 8 | 9 | 10 | |
| Variable costs/pig sold | ||||||||||
| Grain | 5.29 | 5.36 | 5.43 | 5.52 | 5.62 | 5.72 | 5.83 | 5.95 | 6.06 | 6.18 |
| Protein | 2.80 | 2.86 | 2.91 | 2.96 | 3.01 | 3.07 | 3.12 | 3.18 | 3.24 | 3.29 |
| Base mix: vitamins, minerals, etc | 1.34 | 1.36 | 1.38 | 1.40 | 1.42 | 1.45 | 1.48 | 1.51 | 1.54 | 1.57 |
| Feed processing | 0.47 | 0.47 | 0.48 | 0.49 | 0.50 | 0.51 | 0.52 | 0.53 | 0.54 | 0.55 |
| Labor | 5.59 | 5.47 | 5.41 | 5.40 | 5.40 | 5.43 | 5.45 | 5.48 | 5.51 | 5.55 |
| Veterinary, drugs, and supplies | 3.16 | 3.16 | 3.16 | 3.16 | 3.16 | 3.16 | 3.16 | 3.16 | 3.16 | 3.16 |
| Utilities, fuel, and oil | 1.22 | 1.22 | 1.22 | 1.22 | 1.22 | 1.22 | 1.22 | 1.22 | 1.22 | 1.22 |
| Transportation and marketing costs | 1.00 | 1.00 | 1.00 | 1.00 | 1.00 | 1.00 | 1.00 | 1.00 | 1.00 | 1.00 |
| Building and equipment repairs | 0.87 | 0.85 | 0.84 | 0.84 | 0.84 | 0.85 | 0.85 | 0.86 | 0.86 | 0.87 |
| Breeding/genetic charge | ||||||||||
| Depreciation | 14.42 | 6.32 | 4.00 | 2.97 | 2.47 | 2.10 | 1.89 | 1.71 | 1.57 | 1.52 |
| Semen | 1.27 | 1.24 | 1.23 | 1.23 | 1.23 | 1.23 | 1.24 | 1.25 | 1.25 | 1.26 |
| Interest | 0.56 | 0.58 | 0.58 | 0.59 | 0.60 | 0.60 | 0.61 | 0.62 | 0.62 | 0.63 |
| Insurance | 0.08 | 0.08 | 0.08 | 0.08 | 0.08 | 0.08 | 0.08 | 0.09 | 0.09 | 0.09 |
| Professional fees: legal, accounting, etc | 0.24 | 0.24 | 0.24 | 0.24 | 0.24 | 0.24 | 0.24 | 0.24 | 0.24 | 0.24 |
| Interest on 1/2 variable costs | 0.58 | 0.45 | 0.42 | 0.40 | 0.40 | 0.40 | 0.40 | 0.40 | 0.40 | 0.40 |
| A. Total variable costs | 38.88 | 30.67 | 28.38 | 27.50 | 27.19 | 27.06 | 27.09 | 27.17 | 27.29 | 27.52 |
| Fixed costs/pig sold | ||||||||||
| Depreciation on bldgs and equip | 2.51 | 2.46 | 2.43 | 2.42 | 2.43 | 2.44 | 2.45 | 2.46 | 2.48 | 2.49 |
| Interest on bldgs and equip | 1.67 | 1.64 | 1.62 | 1.62 | 1.62 | 1.62 | 1.63 | 1.64 | 1.65 | 1.66 |
| Insurance on bldgs and equip | 0.44 | 0.43 | 0.42 | 0.42 | 0.42 | 0.42 | 0.43 | 0.43 | 0.43 | 0.43 |
| B. Total fixed costs | 4.62 | 4.52 | 4.47 | 4.46 | 4.47 | 4.48 | 4.51 | 4.53 | 4.56 | 4.59 |
| C. Total cost/pig sold | 43.50 | 35.20 | 32.86 | 31.97 | 31.66 | 31.55 | 31.60 | 31.70 | 31.84 | 32.11 |
| D. Gross returns/weaned pig sold | 36.90 | 36.90 | 36.90 | 36.90 | 36.90 | 36.90 | 36.90 | 36.90 | 36.90 | 36.90 |
| E. Return over variable costs | ||||||||||
| (D-A) | -1.98 | 6.23 | 8.52 | 9.40 | 9.71 | 9.84 | 9.81 | 9.73 | 9.61 | 9.38 |
| F. Return over fixed costs (D-B) | 32.28 | 32.38 | 32.43 | 32.44 | 32.43 | 32.42 | 32.39 | 32.37 | 32.34 | 32.31 |
| G. Returns over total costs $/head (D-C) | -6.60 | 1.70 | 4.04 | 4.93 | 5.24 | 5.35 | 5.30 | 5.20 | 5.06 | 4.79 |
| Net return on investment (%) | -7.0 | 8.3 | 12.8 | 14.5 | 15.1 | 15.3 | 15.1 | 14.9 | 14.6 | 14.0 |
* Values gathered from 2001 to 2014.
† Represents the parity distribution on the basis of sow culling strategy. For example, “4” indicates that in the parity distribution scenario, sows are kept until parity 4 and then culled. Sows that are bred but do not conceive or that do not show signs of estrus prior to the final parity in the distribution are culled. Bldgs and equip = Buildings and equipment.
Table 3 includes net return on investment, which is based on the parity distribution scenarios. The same trend that was seen in the budget analysis was also observed, as the greatest return on investment was realized by culling sows after parity 6, followed closely by culling after parities 5 and 7, with culling after parities 5 through 8 all showing approximately a 15% return on investment.
As part of the sensitivity analysis in this study, greater NBA, as well as pre-weaning mortality estimates, were used per parity with all other factors held constant. Figure 2 illustrates the increase in NBA by year groups as well as parity groups. Since 2001, NBA has increased across all parities, with parities 1 through 3 realizing the largest increase in NBA. Records from 2011 to 2014 were used to produce more recent estimates of NBA and pre-weaning mortality, which were then used in the sensitivity analysis. These updated estimates are shown in Figure 3. Parity 3 was again the most prolific parity (P < .05), but pre-weaning mortality rates were greater than those shown in Figure 1. The results from using the updated NBA estimates described in Figure 3 are presented in Table 4. The parity distribution that culled after parity 6 remained the most profitable distribution on the basis of both returns over total costs and net return on investment, followed closely by culling after parity 7. It was observed that culling after parities 5 through 9 showed greater economic returns than culling after parities 1 through 4 (Table 4).
Figure 2: Number born alive (NBA) per litter estimates by parity groups and year groups (averaged least squares means ± standard error), from 105,719 sows. Estimates were averaged across parity groups (1 through 3, 4 through 6, and 7 through 9) and year groups (2001 to 2005, 2006 to 2010, 2011 to 2014). All year-by-parity NBA estimates were found to be statistically different from each other (P < .05; t test) (not shown in figure). Parity group estimates were then calculated by averaging year-by-parity estimates within each parity group. Statistical significance was not re-assessed once the estimates had been averaged. Values gathered from 2001-2014.
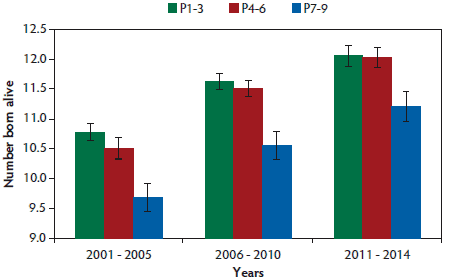
Figure 3: Pigs born alive per litter and pre-weaning mortality (least squares means ± standard error by parity, for parities 1 through 10). * A significant difference was observed between parities for pigs born alive per litter (P < .05; t test).† A significant difference was observed between parities for pre-wean mortality (P < .05; t test) except parity 10, which showed a trend different from other parities (P = .08). Values gathered from 2011-2014.
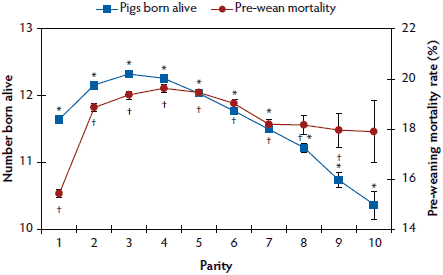
Table 4: Production values, inputs, and outputs used in the economic analysis of sow retention of a 5000-sow breed-to-wean operation in US$*
| Parameter | Parity prior to cull† | |||||||||
|---|---|---|---|---|---|---|---|---|---|---|
| 1 | 2 | 3 | 4 | 5 | 6 | 7 | 8 | 9 | 10 | |
| Pigs born alive/litter | 11.64 | 11.88 | 12.01 | 12.06 | 12.05 | 12.02 | 11.98 | 11.92 | 11.85 | 11.79 |
| Pigs sold/sow/year | 22.86 | 22.88 | 22.94 | 22.92 | 22.86 | 22.78 | 22.70 | 22.60 | 22.48 | 22.35 |
| Pigs sold/year | 114,194 | 114,281 | 114,567 | 114,505 | 114,206 | 113,800 | 113,401 | 112,878 | 112,285 | 111,664 |
| Returns over total costs $/head | -5.06 | 2.34 | 4.39 | 5.19 | 5.46 | 5.58 | 5.56 | 5.47 | 5.34 | 5.11 |
| Net return on investment (%) | -4.6 | 9.6 | 13.6 | 15.1 | 15.6 | 15.8 | 15.7 | 15.5 | 15.2 | 14.7 |
* Values gathered from 2011-2014.
† Represents the parity distribution, based on sow culling strategy. For example “4” indicates that in the parity distribution scenario sows are kept until parity 4 and then culled. Sows that are bred but do not conceive, or that do not show signs of estrus prior to the final parity in the distribution, are culled.
For the low feed price analysis, soybean meal decreased 58%, which equated to a price of $181.54 per ton, and the cost of corn decreased 52%, which equated to a price of $1.92 per cubic meter. The results of the low feed price sensitivity analysis are presented in Table 5. With low feed costs, the optimal parity distribution favors older sows. Specifically, the greatest returns over total costs can be realized by retaining sows through their seventh parity, and retaining sows through their eighth or ninth parity has a greater rate of return over culling before a sow is through her fifth parity. In the high feed price analysis, soybean meal increased 66%, bringing the price to $474.49 per ton, and corn increased 57.6%, bringing the price to $6.41 per cubic meter. None of the parity distributions have positive returns over total costs with high feed prices (Table 5). However, the parity distribution culling after parity 6 was the closest to break-even, followed closely by culling after parity 5.
Table 5: Feed sensitivity economic analysis of sow retention of a 5000-sow breed-to-wean operation on a per weaned pig basis (all prices, costs, and expenses in US$)*
| Parity prior to cull† | ||||||||||
|---|---|---|---|---|---|---|---|---|---|---|
| 1 | 2 | 3 | 4 | 5 | 6 | 7 | 8 | 9 | 10 | |
| Low feed cost analysis‡ | ||||||||||
| Grain cost/pig sold | 2.76 | 2.79 | 2.83 | 2.88 | 2.93 | 2.98 | 3.04 | 3.10 | 3.16 | 3.22 |
| Protein cost/pig sold | 1.64 | 1.67 | 1.70 | 1.73 | 1.76 | 1.79 | 1.82 | 1.85 | 1.89 | 1.92 |
| Total variable costs | 35.12 | 26.86 | 24.52 | 23.57 | 23.19 | 22.98 | 22.93 | 22.94 | 22.97 | 23.12 |
| Total costs/pig sold | 39.74 | 31.38 | 28.99 | 28.03 | 27.66 | 27.47 | 27.44 | 27.47 | 27.53 | 27.71 |
| Gross returns/pig sold | 36.90 | 36.90 | 36.90 | 36.90 | 36.90 | 36.90 | 36.90 | 36.90 | 36.90 | 36.90 |
| Net return on investment (%) | -0.2 | 15.4 | 20.1 | 22.0 | 22.7 | 23.0 | 22.9 | 22.8 | 22.6 | 22.1 |
| Returns over total costs $/head | -2.84 | 5.52 | 7.91 | 8.87 | 9.24 | 9.43 | 9.46 | 9.43 | 9.37 | 9.19 |
| High feed cost analysis§ | ||||||||||
| Grain cost/pig sold | 9.18 | 9.30 | 9.42 | 9.58 | 9.75 | 9.94 | 10.13 | 10.32 | 10.52 | 10.73 |
| Protein cost/pig sold | 4.27 | 4.37 | 4.44 | 4.51 | 4.59 | 4.68 | 4.76 | 4.85 | 4.93 | 5.02 |
| Total variable costs | 44.32 | 36.21 | 33.99 | 33.21 | 33.00 | 32.98 | 33.11 | 33.31 | 33.54 | 33.90 |
| Total costs/pig sold | 48.94 | 40.73 | 38.46 | 37.67 | 37.47 | 37.46 | 37.62 | 37.84 | 38.10 | 38.48 |
| Gross returns/pig sold | 36.90 | 36.90 | 36.90 | 36.90 | 36.90 | 36.90 | 36.90 | 36.90 | 36.90 | 36.90 |
| Net return on investment (%) | -17.0 | -2.04 | 2.20 | 3.72 | 4.11 | 4.12 | 3.83 | 3.42 | 2.96 | 2.26 |
| Returns over total costs $/head | -12.04 | -3.83 | -1.56 | -0.77 | -0.57 | -0.56 | -0.72 | -0.94 | -1.20 | -1.58 |
* Values gathered from 2001-2014.
† Represents the parity distribution, based on sow culling strategy.
‡ The two lowest feed prices from the years 2001-2014 were averaged for protein (soybean meal) and grain (corn) input prices. All other factors were held constant in the analysis.
§ The two highest feed prices from the years of 2001-2014 were averaged for protein (soybean meal) and grain (corn) input prices. All other factors were held constant in the analysis.
Discussion
Although older sows have lower NBA, they wean a greater percentage of their pigs than younger sows. Older sows wean approximately the same number of pigs as the younger sows, which can be associated with their lower pre-weaning mortality rate. Older sows’ pre-weaning mortality rate fell below 14% in parities 7 through 10, suggesting that older sows are able to maintain and rear more piglets during the lactation period than younger sows.
Litters per sow per year, as well as sow inventory, were held constant across all parity distribution scenarios, thus the number of litters produced per year was constant across all scenarios. However, it has been shown in a previous study3 that litters per sow per year were lowest in scenarios where culling occurred after the first and second parities, and was consistent in distribution scenarios culling after parities 3 through 10. Had this been considered, and the litters per sow per year lowered in distributions including only first- and second-parity sows, it would be expected that the optimal parity distributions would still favor distributions having a proportion of older sows. The distributions including older sows would have had more litters per sow per year, thus proving to be even more efficient than that represented in the present study.
Results indicate that retaining sows until later parities, (ie, parity 8 and 9), could be economically advantageous over culling sows after parities 1 through 4, as shown by a higher return over total cost. Though older sows produce and sell slightly fewer pigs per year than younger sows, the cost in producing a weaned pig is lowest when sows are culled after parities 5 through 9. The results shown are similar to those previously observed in other economic analysis studies, ie, that the cost of a weaned pig is highest in first-parity sows and decreases in other parities.3 With the current average parity of culling in the United States at 3.1 to 3.7,10 results indicate there is a substantial profit gap that could be reduced by keeping sows until later parities to increase return per weaned pig. The current study showed that a producer may be losing as much as $0.42 per weaned pig by culling at the current industry averages rather than retaining sows until the returns over total costs is higher.
With more pigs sold per year, costs associated with annual production can be distributed among the larger number of pigs sold, thus decreasing cost on a per weaned-pig basis. However, there are other costs associated with each parity distribution, such as age and size of the sows, which must be considered as well. Some additional costs that need consideration are, for example, feed costs, which will be greater for older sows, as they are heavier and have a higher maintenance level feed requirement,27,28 but depreciation of the breeding herd is minimized in older sows as it is able to be spread over more parities. The cost associated with a higher replacement rate can be observed in the higher cost per weaned pig specifically associated with depreciation of the breeding herd. The depreciation per weaned pig is a function of sow mortality rate per parity distribution and the respective replacement gilt costs that need to spread across pigs weaned throughout her productive lifetime. The lower the replacement rate of the parity distribution, the lower the cost associated with breeding-herd depreciation per weaned pig. With all the previous considered, it was shown that culling after parity 6 minimized costs per weaned pig, even though culling after parity 4 produced the most saleable weaned pigs. The advantage of retaining sows is clearly demonstrated, as retaining a sow until her ninth parity is shown to have a greater rate of return than what most commercial pork producers are currently receiving<> today by culling sows after their third or fourth parity.
As this study analyzed return over total cost on a per weaned-pig basis, a recommendation on how the optimal parity distribution will be influenced when pigs are followed through finishing cannot be made. However, numerous studies show the benefits of offspring from older sows through finishing. Offspring from primiparous dams have lower average daily gain,2,29,30 as well as increased mortality in the nursery and finishing phases when compared to offspring from older sows.30 It has been reported that market hogs from mature sows were significantly more profitable than market hogs from first-parity sows.31 The difference seen in the offspring from first-parity sows, compared to the offspring from older dams, is due, at least in part, to the poorer health status of the first-parity offspring.2,29,30 We hypothesize that if this analysis were performed on a per finished-hog basis, the recommended parity distribution would still favor distributions with a greater percentage of older sows.
Return on investment is considered to be an indicator of profitability, and it has been recommended that a company needs a minimum of 10% to 14% return on investment to fund future growth.32 It has also been shown that investment in a breed-to-wean operation was favorable over other investments given a similar risk profile that is based on the modified internal rate of returns.33 Approximately a 15% return on investment was realized in the scenarios that culled sows after parities 5 through 8, again emphasizing the value of retaining sows in the breeding herd longer than what is currently being reported.
Through genetic improvement and better management practices, NBA has steadily increased.34 The sensitivity analysis demonstrating increased NBA also showed a higher pre-weaning mortality. A higher pre-weaning mortality is not advantageous for the producer, as the greater the pre-weaning mortality rate, the fewer pigs are weaned per sow. A large factor in the high pre-weaning mortality rate used was the influence of the porcine epidemic diarrhea virus (PEDV) outbreak that occurred during these years used in this portion of the sensitivity anaylsis.19 However, even with pre-weaning mortality rates an average of 4% greater per parity in 2011 to 2014, sows still were shown to wean and sell more pigs than in the base scenario due to the increase in NBA. These results follow the same trend that was observed in the base scenario with a lower NBA and pre-weaning mortality rate, indicating that the increase in sow performance across all parities did not have a large effect on the optimal parity distribution. However, it can be seen that the difference in returns between culling after parity 6 and 7 was smaller in the scenario with higher NBA. If NBA were to increase, it can be hypothesized that older sows (ie, parity 7) become most profitable.
A number of educated assumptions were required as factors impacting the optimal parity distribution for this economic analysis. The validity of those assumptions should be tested over time.
Implications
- By improving sow longevity, the profitability of the breeding herd should improve as costs associated with replacement gilt expenses are reduced.
- The economic benefits of retaining sows into their later parities (parities 5 through 9) include increased returns over total costs, as well as increased net return on investment.
- Producers could increase returns per weaned pig above what is currently being realized in the commercial swine industry by retaining sows in the herd longer.
Conflict of interest
None reported.
Disclaimer
Scientific manuscripts published in the Journal of Swine Health and Production are peer reviewed. However, information on medications, feed, and management techniques may be specific to the research or commercial situation presented in the manuscript. It is the responsibility of the reader to use information responsibly and in accordance with the rules and regulations governing research or the practice of veterinary medicine in their country or region.
References
1. Lucia T, Dial G, Marsh W. Estimation of lifetime productivity of female swine. J Am Vet Med Assoc. 1999;214:1056–1059.
2. Carney-Hinkle E, Tran H, Bundy J, Moreno R, Miller P, Burkey T. Effect of dam parity on litter performance, transfer of passive immunity, and progeny microbial ecology. J Anim Sci. 2013;91:2885–2893.
*3. Dhuyvetter K. What does attrition cost and what is it worth to reduce? Proc Allen D. Leman Swine Conf. St Paul, Minnesota: University of Minnesota College of Veterinary Medicine; 2000:110–116.
*4. Stevermer EJ. How our production cost is impacted by changes in reproductive efficiency. Proc Professional Swine Managers’ Conf. 1991;16:35–40.
*5. Morrison B, Larriestra A, Yan J, Deen J. Determining optimal parity distribution with a push model of gilt supply. Proc Allen D. Leman Swine Conf. 2002;173–177.
6. Spörke J. Gilt development techniques that alleviate SPL concerns. 13th Discover Conf Sow Productive Lifetime; 2007.
7. Stalder K, Lacy R, Cross T, Conatser G, Darroch C. Net present value analysis of sow longevity and the economic sensitivity of net present value to changes in production, market price, feed cost, and replacement gilt costs in a farrow-to-finish operation. Prof Anim Scientist. 2000;16:33–40.
*8. Abell C, Jones G, Stalder K. Determining optimal maximum culling parity in commercial breeding sow herds. Proc AASV. Omaha, Nebraska. 2010;3:219–224.
9. Sasaki Y, McTaggart I, Koketsu Y. Assessment of lifetime economic returns of sows by parity of culled sows in commercial breeding herds. J Vet Epidemiol. 2012;16:37–45.
10. Stalder K, Lacy R, Cross T, Conatser G. Financial impact of average parity of culled females in a breed-to-wean swine operation using replacement gilt net present value analysis. J Swine Health Prod. 2003;11:69–74.
11. R Core Team. R: A language and environment for statistical computing. R Foundation for Statistical Computing, Vienna, Austria; 2015.
*12. U.S. Department of Agriculture, Agricultural Marketing Service (USDA-AMS). National Direct Delivered Feeder Pig Report. All reports from 2001-2014. 2016. Available at https://www.ams.usda.gov/mnreports/nw_ls255.txt. Accessed 15 March 2017.
*13. U.S. Department of Agriculture, Agricultural Marketing Service (USDA-AMS). Iowa/Minnesota Daily Direct Prior Day Hog Report. All reports from 2001-2014. 2016. Available at https://www.ams.usda.gov/mnreports/lm_hg204.txt. Accessed 15 March 2017.
*14. Swine Grading. Department of Animal Science SDSU. 2016. Available at https://www.sdstate.edu/ars/students/activities/judging/evaluation/swine-grading.cfm. Accessed 15 March 2017.
*15. Johnson R. Role of genetics in gilt attrition. Animal Science Department: University of Nebraska. Proc Allen D. Leman Swine Conf. 2000:105–109.
*16. Dhuyvetter K. Optimal parity distribution–when is the best time to cull sows? Swine Day 2000-Department of Agricultural Economics. 2000. Available at http://krex.k-state.edu/dspace/handle/2097/2715. Accessed 15 March 2017.
17. Serenius T, Stalder K, Baas T, Mabry J, Goodwin R, Johnson R, Robison O, Tokach M, Miller R. National Pork Producers Council Maternal Line National Genetic Evaluation Program: A comparison of sow longevity and trait associations with sow longevity. J Anim Sci. 2006;84:2590–2595.
*18. U.S. Department of Agriculture, Agricultural Marketing Service (USDA-AMS).Weekly National Direct Swine Report. All reports from 2002-2014. 2016. Available at https://www.ams.usda.gov/mnreports/lm_hg214.txt. Accessed 15 March 2017.
*19. Productivity: Pork Checkoff. 2009-2014 ANALYSIS. U.S. Pork Industry Productivity Analysis 2015 Summary. 2015. Available at http://www.pork.org/wp-content/uploads/2010/04/pork-industry-productivity-analysis-2015-summary.pdf. Accessed 15 March 2017.
*20. Benchmarking Summaries. PigChamp USA. All reports from 2006-2014. 2016. Available at http://www.pigchamp.com/benchmarking/benchmarking-summaries. Accessed 15 March 2017.
*21. Soybean Meal Monthly Price- US Dollars per Metric Ton. IndexMundi. 2016. Available at http://www.indexmundi.com/commodities/?commodity=soybean-meal&months=180. Accessed 15 May 2017.
*22. Marketing and Outlook: US Average Farm Price Received Database. University of Illinois: (Corn). All reports from 2001-2014. 2016. Available at http://www.farmdoc.illinois.edu/ manage/uspricehistory/us_price_history.html. Accessed 15 March 2017.
*23. Iowa Farm Custom Rate Survey. Iowa State University: Extension and Outreach, Ag decision maker (Grinding, mixing/ton). All reports from 2001-2014. 2016. Available at https://www.extension.iastate.edu/agdm/crops/html/a3-10.html. Accessed 15 March 2017.
*24. Livestock Summary Report: Hogs – Farrow to weaning per head. FinBin. All reports from 2002-2014. 2016. Available at https://finbin.umn.edu/LvSummOpts/LvSummIndex. Accessed 23 May 2017.
*25. Ag Credit Survey Interest Rates (KS,MO,NE). Federal Reserve Bank of Kansas City. All reports from 2001-2014. 2016. Available at https://www.kansascityfed.org/research/indicatorsdata/agcreditsurvey. Accessed 24 May 2017.
*26. Schulz L. Procedure for estimating returns farrow to wean. Livestock Extension; Iowa State University. 2014. Available at http://www2.econ.iastate.edu/estimated-returns/Farrow to Wean Procedure.pdf. Accessed 15 March 2017.
*27. van Huegten E. Feeding recommendations for gestating sows. Animal Science Facts: Extension Swine Husbandry-North Carolina State University. 2001;ANS00-810S.
*28. English P, William S, MacLean A. The Sow: Improving her Efficiency. Farming Press Limited: Suffolk, England. 1977.
29. Mahan D. Relationship of gestation protein and feed intake level over a five-parity period using a high-producing sow genotype. J Anim Sci. 1998;76:533–541.
*30. Burkey T, Miller P, Johnson R, Reese D, Moreno R. Does dam parity affect progeny health status? Nebraska Swine Reports. 2008;36.
*31. Mabry J. An overview of the last 10 years of benchmarking data. PigChamp 2015 Spring Edition. 2015;15–19. Available at https://www.researchgate.net/file.PostFileLoader.html?id=55e747a65cd9e355fd8b45d5&assetKey=AS%3A273844693078023%401442301071005. Accessed 23 May 2017.
*32. Financial ratios: Advameg, Inc. Available at http://www.referenceforbusiness.com/small/Eq-Inc/Financial-Ratios.html. 2016. Accessed 23 May 2017.
33. Rodriguez-Zas SL, Davis C, Ellinger P, Schnitkey G, Romine N, Connor J, Knox R, Southey B. Impact of biological and economic variables on optimal parity for replacement in swine breed-to-wean herds. J Anim Sci. 2006;84:2555–2565.
*34. Loula T, Waddell, J, Abell C, Jones G, Stalder K, Alumbaugh J, Osmundson E. Improving reproductive efficiency. PigChamp Benchmark 2010 Edition; 2010:5.
* Non-refereed references.