| Original research | Peer reviewed |
Cite as: Weimer SL, Johnson AK, Fangman TJ, et al. Comparison of nursery pig behavior assessed using human observation and digital-image evaluation methodologies. J Swine Health Prod. 2014;22(3):116–124.
Also available as a PDF.
SummaryObjectives: To design and implement a digital photograph system to document the pig response to a human observer in the home pen and then compare these results to a human observation in an approach-assessment paradigm. Materials and methods: An observer entered the nursery pen and crouched down with an outstretched arm for 15 seconds. A digital image was recorded, and the observer counted all pigs touching, oriented, and not oriented to the human. Each digital image was used to determine the snout and tail-base proximity to the index finger of the observer for pigs classified as Touch, Oriented, and Not Oriented when pens were divided into thirds and quarters. Postures and behaviors of pigs classified as Not Oriented were further delineated. Human observation and digital image were compared. Results: Most Not Oriented pigs in the digital image were standing, followed by sitting, with 2.5% piling. Both snout and tail-base proximities were closer for Touch pigs than for the other categories (P < .001). Regardless of how pens were divided, more pigs were located in the section farthest from the observer. There were no differences (P > .05) between human observation and digital-image evaluation for pigs classified as Touch. More pigs were classified as Oriented and fewer as Not Oriented for digital-image evaluation (P < .001). Implication: Human observation is a faster and practical application, but digital-image evaluation allows for more information to be collected. | ResumenObjetivos: Diseñar e implementar un sistema de fotografía digital para documentar la respuesta del cerdo al observador humano en el corral hogar y luego comparar estos resultados con la observación humana en un paradigma de acercamiento-evaluación. Materiales y métodos: Un observador entró al corral de destete y se agachó con el brazo extendido por 15 segundos. Se tomó una imagen digital y el observador contó a todos los cerdos que lo tocaron, se orientaron, y no se orientaron hacia el humano. Cada imagen digital se utilizó para determinar la proximidad del hocico y la base de la cola al dedo índice del observador de los cerdos clasificados como tocar, se orienta, y no se orienta cuando los corrales se dividieron en tercios y cuartos. Las posturas y conductas de los cerdos clasificados según la orientación se describieron más a fondo. Se comparó la observación humana y la imagen digital. Resultados: La mayoría de los cerdos no orientados en la imagen digital estaban de pie, luego sentados, y 2.5% amontonados. La proximidad de hocico y de base de la cola fue más cercana para los cerdos tocando que para las otras categorías (P < .001). Independientemente de cuantos corrales se dividieron, se localizaron más cerdos en la sección más lejana del observador. No hubo diferencias (P > .05) entre la observación humana y la evaluación de la imagen digital y en cerdos clasificados como que tocaron. Se clasificaron más cerdos como orientados y menos como no orientados en la evaluación de la imagen digital (P < .001). Implicación: La observación humana es una aplicación más rápida y práctica, pero la evaluación de la imagen digital permite le recolección de más información.
| ResuméObjectifs: Élaborer et implémenter un système de photographie digitale afin de documenter la réponse de porcs à un observateur humain dans l’enclos et de comparer les résultats à une observation humaine dans un paradigme d’évaluation de l’approche. Matériels et méthodes: Un observateur entra dans l’enclos de pouponnière et s’accroupit avec un bras étendu pendant 15 secondes. Une image digitale fut enregistrée, et l’observateur compta tous les porcs touchant, orientés, et non orientés vers l’humain. Chaque image digitale fut utilisée pour déterminer la proximité du groin et de la base de la queue à l’index de l’observateur pour les porcs classés comme touchant, orientés, et non orientés lorsque les enclos étaient divisés en tiers et en quarts. Le comportement et la posture des porcs classifiés comme non orientés étaient définis un peu plus. Les observations humaines et les images digitales étaient comparées. Résultats: La plupart des porcs non orientés dans les images digitales se tenaient debout, suivi par la posture assise, et 2,5% étaient entassés. Les mesures de proximité du groin et de la base de la queue étaient plus courtes (P < .001) pour les porcs touchant comparativement aux autres catégories. Indépendamment de la manière dont étaient divisée les enclos, plus de porcs étaient situés dans la section la plus éloignée de l’observateur. Il n’y avait pas de différence (P > .05) entre l’observation humaine et l’évaluation des images digitales pour les porcs classifiés comme touchant. Plus de porcs étaient classifiés comme étant orientés et moins comme non orientés par évaluation d’images digitales (P < .001). Implication: L’observation humaine est une application pratique et plus rapide, mais l’évaluation par image digitale permet d’amasser plus d’informations. |
Keywords: swine, animal-human interaction, behavior, method
Search the AASV web site
for pages with similar keywords.
Received: August 29, 2012
Accepted: July 25, 2013
On-farm welfare assessment involves the practical evaluation of animal state, defined as health, performance, physiological, behavioral, and cognitive functions of the animals under commercial farm conditions. This is an exercise carried out by scientists and practitioners for many different reasons, including adherence to assessment welfare standards for the purpose of farm assurance schemes. When an animal is placed in a situation that it perceives as frightening or calming, it may react internally via physiological changes1-4 that can be measured externally using behavioral assessment. When an animal is fearful, it may react in one of three ways: “fight,” “flight,” or “freeze.” A variety of animal-human interaction tests have been used primarily to measure fear,1 for example the open field,5 human approach,6 and novel approach7 tests, respectively. Numerous investigators have published results that have compared the animal-human interaction using these tests, but it is difficult to compare and contrast the findings because of the different enclosure size,8 time latencies for animals to make contact, and the observer’s posture9 (ie, sitting versus standing). de Passillé and Rushen10 noted that although these issues may seem relatively minor, it is unclear how these extraneous variables affect the measures collected and thus the interpretations made. Nevertheless, animal-based measures, as opposed to resource-based measures, continue to be included in on-farm welfare assessment programs. For example, the recent Welfare Quality project11 aims to develop reliable, standardized, on-farm welfare-assessment protocols using predominately animal-based measures of behavior for different farm species, including pigs. One such animal-based measure has been the animal-human relationship, in particular the assessment of fear, eg, proximity to the human, avoidance, piling, or escaping.12-14 The underlying assumption of proximity is that the most fearful animals will keep the greatest distance from humans. However, this conclusion may be too simplistic, as an animal’s “willingness to approach,” touch, or avoid a human may not be solely reflective of fear.2,3 Animals have competing motivational behavioral systems that include curiosity,15 feeding,16 and exploration of the environment.17 Therefore, classifying pigs’ proximity to the person, along with the behaviors and postures that the pigs are engaged in, would provide more information to determine levels of fear, eg, is a pig in the most distant corner of the pen trying to escape or is it eating? This information is critical for drawing correct conclusions on the animal-human relationship within the overall welfare assessment score of the farm, which in turn could affect market access. Many of the animal-human interaction tests are conducted using a live methodology, which allows the assessor to capture limited information, eg, the number of animals touching or not touching a human. If a digital method could be created and used on a commercial farm to capture pigs at a given time point (ie, a “snapshot in time”), then behavioral classifications, precise proximity to the human observer, and pig location within the home pen might provide a more objective and repeatable result than a human methodology. Therefore, the objectives of this study were to design and implement a digital photograph system to document the pig response to a human observer in the home pen, and then compare the results of the digital photograph system to human observation in an approach-assessment paradigm.
Materials and methods
Animal care and husbandry protocols for this experiment were overseen by the company veterinarian and farm manager. These protocols were based on the US swine industry guidelines presented in the Swine Care Handbook18 and in Pork Quality Assurance Plus.19 In addition, all procedures were approved by the Iowa State University Institutional Animal Care and Use Committee.
Animals
The study was conducted March 8, 2011, at a commercial nursery site situated southwest of Ames, Iowa. Pigs were 6-week-old barrows and gilts from a commercial crossbred genetic line (Midwest Farms, Burlington, Colorado), weighing approximately 25 kg. Pigs were not individually weighed before the study began. Average body weight was determined from previous performance records kept on-site for nursery pigs of that age and genetic cross.
Housing and feeding
A total of 79 nursery pens in two rooms (40 in Room 1 and 39 in Room 2) were used for the study, housing approximately 22 pigs per pen (0.3 m2 per pig). Pens measured 1.8 m × 3 m, with steel dividers (81.3 cm height) between pens and one steel gate at the front of each pen (91.4 cm height). Ten pens were situated on the right side of the room, 10 on the left, and 20 in the center, separated by two alleyways (76.2 cm width). A fence-line round feeder (radius 55.9 cm, height 81.4 cm; Osborne Industries, Osborne, Kansas) with a feed capacity of 76 kg was located in each pen, 79 cm from the front gate. Pigs had ad libitum access to a meal-grind diet (1510 kcal per kg metabolizable energy and 18.1% crude protein) formulated to meet requirements.20 Each pen contained one stainless steel nipple drinker (Suevia Haighes, Kircheim, Germany) on the side opposite to the feeder, except for the end pens, where the drinker was located on the side of the feeder farthest from the alleyway. Polygrate flooring (12.7 mm gauge slats; Faroex Ltd, Gimli, Manitoba, Canada) was utilized in all pens. The ceiling height in the nursery rooms was 2.6 m. Twenty fluorescent lights were turned on at 7:00 am for daily chores and then were turned off at approximately 4:00 pm. Two night lights were on 24 hours per day. Rooms were mechanically ventilated using two variable-speed pit fans (Osborne Industries) with 18 inlets, and wall fans (Osborne Industries) set at 0.14 m3 per pig. Average room temperature was 23.5°C (Guardian Forced Air Heaters; L. B. White, Onalaska, Wisconsin). Caretakers observed all pigs twice daily.
Experimental design
A complete randomized experimental design with the pen of pigs as the experimental unit (n = 79) was used. A nursery-pen image-capturing device was developed and used. Two treatments, a human observer and the digital image, were assigned within rooms and to all pens. The methodology followed that previously described by Fangman et al.6 On the day of the approach assessment, a human observer approached the nursery home pen, positioned the image-capturing device at the midpoint of the front pen gate, and quietly stepped over the gate, immediately crouching down at the center of the gate. She extended and held still the left leather-gloved hand with the index finger extended, and began a stop watch, avoiding eye contact with the pigs for a 15-second period. The left hand and finger were extended to allow for the same anatomical location to be clearly visible on each digital image so that distances could be measured (Figure 1). At the end of the 15-second period, the observer looked behind her to ensure the sensor light on the digital camera had deployed and captured the digital image, then looked back at the pigs and recorded the live-observation counts for the Touch, Oriented, and Not Oriented categories for pigs that were touching, oriented to, or not oriented to the observer, respectively. After counting all the pigs, the observer retraced her steps and exited the nursery pen. The live observation numbers for pigs engaged in each of the three behaviors were recorded on a scan sheet located in the central alleyway. The observer then proceeded in a side-to-side fashion until all 79 pens in the room had been entered, scanned, and recorded. At the laboratory, each digital image was used to determine the snout and tail-base proximity from the index finger of the observer for pigs classified as Touch, Oriented, and Not Oriented, and the locations of the pigs relative to the observer when pens were divided into thirds and quarters. Postures and behaviors of pigs classified as Not Orientated were further delineated. Finally the two methodologies (human observation and digital image) were compared for pigs touching, oriented, or not oriented to the human in their home pen.
Figure 1: Examples of nursery pigs classified, using a digital image system, as Touch (numbers 4, 5, 6, and 10), Oriented (numbers 3, 7, 8, 9, 12, 17), and Not Oriented (numbers 1, 2, 11, 13, 14, 15, 16, 18, 19, 20, 21, and 22). The human observer knelt in the home pen with an outstretched arm for 15 seconds, then classified the behavior of the pigs, using a remote control to take the digital images, and also recording her observations on paper after leaving the pen. 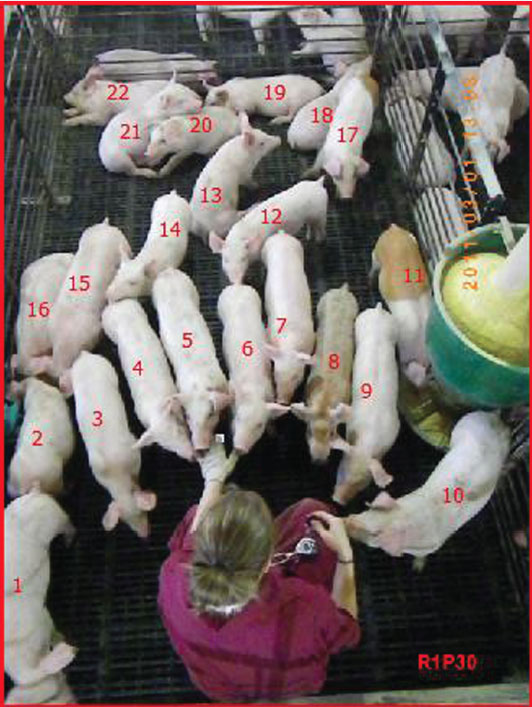 |
Nursery-pen image-capturing device
The goal was to construct an easily moveable device with the shortest height that would capture the entire nursery pen without distortion in the resulting digital image. Results of a pilot study (data not published) showed that the maximum height of the digital image-capturing device was 2.3 m, limited by the ceiling height of 2.6 m and allowing 3 cm space to aid in moving the device from pen to pen. The device was free standing in the alleyway next to each pen gate (Figure 2). This device had a steel base (20.3 cm × 45.7 cm × 3.2 mm depth; The Steel Works, Denver, Colorado). A cast-iron base (10.2-cm radius; LDRI Industries Inc, North Wikesboro, North Carolina) welded on top of the steel base 17.8 cm from both the right and the left sides provided increased stability. A PVC pipe (2.5 cm width × 1.6 m height; Silver-Line Plastics Davenport, Iowa) was screwed into the cast-iron base. Using a PVC connector, (radius 2.5 cm; Lasco Fittings Inc, Brownsville, Tennessee), a second PVC pipe (height 42.3 cm; Silver-Line Plastics) was added to the top of the 1.6-m PVC pipe to create a nursery-pen image-capturing device 2.3 m high. At the top of the PVC pipe, a PVC T (Lasco Fittings Inc) was inserted. An additional PVC T was inserted on the right side of the first PCV T so that the tripod head could be angled 60° relative to the vertical PVC pipe. The camera (Pentax Optio W90 model; Pentax Imaging Company, Golden, Colorado) was held in place by a tripod head (length 28.6 cm) and protruded 11.4 cm behind the nursery-pen image-capturing device. The camera was equipped with an infrared wireless shutter remote control (Pentax Imaging Company) to record the images while the observer was in the nursery pen. The digital camera was angled at 30° relative to the horizontal tripod head and was secured in position using tape. The camera focal length was 28 mm, with a resolution of 3 megapixels. The device was positioned in the alleyway at the midpoint of the front pen gate where there were no feeder obstructions, and the image captured the entire nursery pen. After taking multiple pictures with the tripod head angle ranging from 0° to 60°, a final angle of 60° relative to the vertical PVC pipe was determined. A series of digital images over the nursery pen determined a final 30° vertical camera angle relative to the horizontal tripod head. These device heights and angles produced a digital picture that allowed the whole nursery pen and all pigs to be captured without distortion.
Figure 2: Schematic of the nursery-pen image-capturing device used to capture a digital image that was compared to live human observation of nursery pigs, as described in Figure 1.  |
Measures
Behaviors and postures of pigs classified as Not Oriented. Using the digital image, pigs in the Not Oriented category were allocated to four mutually exclusive postures or two behaviors using digital-image evaluation (Table 1). To maintain the mutual exclusiveness of “head in feeder” and “mouth around drinker,” the posture of the pig was not recorded. Pig percentages were calculated by dividing the total number of pigs in a given Not Oriented category by the total number of pigs in the pen. These data are presented descriptively.
Table 1: Behavior classification of nursery pigs in a live human interaction test*
* Pig postures and behaviors evaluated following completion of the 15-second animal-human interaction test, from both live observation and digital-image evaluation. Observation methods described in Figure 1. Ethogram adapted from Hurnik et al.21 |
||||||||||||||||||||||
Snout and tail-base proximity. Using the digital image, proximity (cm) from the index finger of the human observer to the snout and tail base for each pig was measured. Snout and tail-base anatomical locations were chosen because they were visible in more digital images than other anatomical locations, such as the pig ear or hoof. If a pig snout or tail base was not clearly visible in the digital image, proximity was replaced as an unobservable value in the data set. It was possible to collect 1793 total snout and tail-base anatomical data locations.
Snout was defined as the midpoint of the superior snout, and tail base was defined as the point of the pig’s superior rear where the tail began. Snout and tail-base proximities were measured using the ruler tool in Adobe Photoshop CS5 (Adobe Systems Inc, San Jose, California). In order to determine the actual distance in cm for snout proximity, lengths collected from the digital image using the Adobe ruler were converted. The converted distance was calculated using the actual feeder radius (55.9 cm) and the feeder radius in pixels (556 pixels) from the digital image using the Adobe ruler tool. The conversion ratio was 9.9 (556 pixels ÷ 55.9 cm = 9.9).
Location of nursery pigs in relation to a human observer. Using the digital image, the length of the nursery pen was measured with the Adobe Photoshop ruler tool from the pen gate located directly behind the midpoint of the observer’s back (defined as the dorsal medial point) to the opposite wall of the pen. The total length of the pen was 220 cm. To compare the locations of pigs relative to a human observer, a transparency was fixed onto the monitor screen and the home pen was divided into quarters and thirds of the pen length. To create quarters, dividing lines were drawn at 55.0, 110.0, and 165.0 cm, providing four sections each 55.0 cm long. To create thirds, dividing lines were drawn at 73.3 and 146.6 cm, providing three sections each 73.3 cm long. Pigs were then counted within the section lines. A pig was considered in a section if both eyes and at least one complete ear were inside the line. Data for location of the nursery pig relative to the human observer when the pen was divided into thirds and quarters are presented descriptively.
Comparing a digital image to a human observation in an approach-assessment paradigm. Pigs were classified into three behavioral categories: Touch, Oriented, and Not Oriented using the human observer and the digital image captured by the image-capturing device. Pig percentages were calculated by dividing the total number of pigs classified in each category by the total number of pigs in the pen.
Statistical analysis
All data were evaluated for normal distribution before analysis by using the PROC UNIVARIATE procedure of SAS (SAS Institute Inc, Cary, North Carolina). A P value of < .05 was considered significant. Data used to evaluate Touch, Oriented, and Not Oriented failed to meet the assumption of normally distributed data. These data were analyzed by using the PROC GLIMMIX procedure of SAS (SAS Institute Inc). The generalized linear mixed model included the fixed effects of methodology (human observation and digital-image evaluation). Total number of pigs per pen was used as a linear covariate. A Poisson distribution was noted for pig counts and used in the evaluation using PROC GLIMMIX procedures. Further, the I-Link option was used to transform the mean and standard error (SE) values back to the original units of measure to better understand the results.
Data used to evaluate snout and tail-base proximity to the observer’s index finger met the normal distribution assumption for the ANOVA test. These data were analyzed using the PROC MIXED procedure of SAS. Two statistical models were used to analyze snout and tail-base distance from the observer index finger separately. The fixed effect of room (Room 1 and Room 2) and pig behavior (Touch, Oriented, and Not Oriented) were included. Pen by room and position by pen by room were nested and were included as a random effect in the model. The PDIFF option was used to determine differences between pig positions.
Results
The time spent counting pigs differed, with the observer spending approximately 45 seconds in each pen conducting the live human observation method, in contrast to a digital image that can be analyzed infinitely. For this study, the researcher spent approximately 15 minutes examining each digital image to count and classify pigs.
Behaviors and postures. A total of 46.5% of pigs in a pen were classified either as Touch or Oriented using digital image evaluation, and 53.5% were classified as Not Oriented. For pigs classified as Not Oriented, the majority were standing, followed by sitting, with 2.5% piling (Table 2).
Table 2: Average number and percentage of commercial nursery pigs per pen classified as Not Oriented and exhibiting defined postures and behaviors identified using digital-image evaluation*
* Nursery pens measured 1.8 m × 3 m and housed approximately 22 pigs/pen with 79 pens total. Methods of observation and classification described in Figure 1 and Table 1. Postures and behaviors of Not Oriented pigs described in Table 1. |
||||||||||||||||||||||||||||||
Snout and tail-base proximity. Both snout and tail-base proximities for Oriented pigs were closer to the observer’s index finger than for pigs classified as Not Oriented (P < .001; Table 3). Snout proximity did not differ by room (Room 1, 56.1 ± 1.1 cm; Room 2, 57.8 ± 1.2 cm; P = .26). Tail-base proximity did differ by room: pig tail bases were closer to the observer’s index finger in Room 1 (87.8 ± 1.0 cm) than in Room 2 (92.7 ± 1.1 cm; P < .001).
Table 3: Nursery-pig snout and tail-base proximities from the index finger of a human observer using a digital-image evaluation within the behavior categories Touch, Oriented, and Not Oriented *
* Proximity of anatomical locations on the pig to the index finger of the human observer with her hand and arm outstretched. Snout and tail-base proximities measured using the ruler tool in Adobe Photoshop CS5 (Adobe Systems Inc, San Jose, California). To determine the actual distance for the snout, lengths collected from the digital image using the Adobe ruler were converted by using the actual feeder radius (55.9 cm) and the feeder radius in pixels (556 pixels). The conversion ratio was 9.9 (556 pixels ÷ 55.9 cm). Nursery pens (1.8 m × 3 m) housed approximately 22 pigs/pen. Behavior categories described in Table 1. abc Within a row, values with different superscripts differ significantly (P < .05; ANOVA). NA = not applicable. |
|||||||||||||||||||||||
It was not possible, using the digital-image evaluation, to measure the proximity of the observer’s index finger for 35.6% of tail bases (639 total pig data values or 7.8 pigs per pen) and 59.4% of snouts (1066 total pig data values or 13.1 pigs per pen). The majority of unobservable anatomical locations for snout were in the Not Oriented category (45.0%), compared to 9.6% in the Touch category and 4.1% in the Oriented category. The tail-base location followed a similar pattern, with pigs in the Not Oriented category having the most unobservable anatomical locations (22.0%), followed by the Oriented (10.4%) and Touch categories (2.8%).
Location of nursery pigs in relation to a human observer. Fewer pigs were in the section closest to the observer when the pen was divided into quarters (2.7 %; Figure 3) than when it was divided into thirds (6.4%; Figure 4). Regardless of how pens were sectioned, more pigs per pen were located in the section farthest from the human observer (41.8% for quarters, Figure 3; and 52.9% for thirds, Figure 4). When the pen was sectioned into thirds, a total of 15 pigs could not be clearly allocated to a section, compared to only four pigs when the pen was sectioned into quarters. The pigs that could not clearly be allocated were on the borderline (one and a half ears over or on the section line) of the section definition parameters (both ears over the section line).
Figure 3: Percent of nursery pigs located within a nursery-pen section when the pen was divided into quarters for the approach assessment described and illustrated in Figure 1. The length of the nursery pen (220 cm) was measured with the Adobe Photoshop ruler tool (Adobe Systems Inc, San Jose, California) from the pen gate located directly behind the midpoint of the observer’s back (defined as the dorsal medial point) to the opposite end of the pen. A transparency was taped to the computer monitor and dividing lines were drawn at 55.0 cm, 110.0 cm, and 165.0 cm to create four equal sections of the pen length, with the observer located in the first quarter (0% to 25% of the pen length). Pigs were counted within the section lines. A pig was considered in a section if both eyes and at least one complete ear were inside the line.  |
Figure 4: Percent of nursery pigs located within a nursery pen section when the pen was divided into thirds. The length of the nursery pen was measured with the Adobe Photoshop ruler tool (Adobe Systems Inc) from the pen gate located directly behind the midpoint of the observer’s back (defined as the dorsal medial point) to the opposite end of the pen. The total length of the pen was 220 cm. A transparency was taped to the computer monitor and dividing lines were drawn at 73.3 cm and 146.6 cm to create three equal sections of the pen length, with the observer located in the first third (0% to 33.3% of the pen length). Pigs were counted within the section lines. A pig was considered in a section if both eyes and at least one complete ear were inside the line.  |
Comparing a digital image to a human observation in an approach-assessment paradigm. There were no differences in the pigs classified as Touch when live human observation and digital-image evaluation were compared (P > .05). More pigs were classified as Oriented and fewer were classified as Not Oriented using digital-image evaluation than live human observation (P < .001; Table 4).
Table 4: Least squares means ± standard error of numbers of nursery pigs per pen classified as Touch, Oriented, and Not Orientated by a human observer in the pen and by digital-image evaluation (n = 79 pens)*
* Commercial pens measuring 1.8 m × 3 m, each housing approximately 22 pigs (0.3 m2/pig). Human observation counts were made in real-time; digital-image evaluation counts were made from the digital image captured at the time of live observation. Method of human observation described and illustrated in Figure 1. Behavior classifications described in Table 1. † Generalized linear mixed model with a t test. The P values in parentheses represent comparisons on the basis of percent of pigs/pen in each classification. A P value of < .05 was considered statistically significant.
|
Discussion
The majority of pigs in this study (53.5%)were classified by the digital image method as Not Oriented. If this animal-human interaction test was to be used practically for assessing nursery-pig welfare, it would be advantageous for pigs classified as Not Oriented to be further delineated into discrete behaviors and postures. Determining what these pigs are engaged in would provide a “snapshot in time” for producers, veterinarians, or assessors of the pigs’ overall comfort level. It might be erroneous to conclude that all pigs classified as Not Oriented are fearful of the human in their home pen and therefore are in a compromised state of welfare. As a caveat, classifying these Not Oriented pigs is time consuming, and the digital-image evaluation methodology would likely not be accepted as an industry on-farm assessment program. Therefore, if “negative” behavior(s), ie, attack (“fight”), pile, or escape, or avoidance (“flight”)6,7,22 were counted instead of behaviors and postures from motivational systems considered to be positive for pig welfare, then only a few pigs in a pen would likely need to be counted, and the remainder would be counted as “acceptable” or “not fearful.” An additional reaction that fearful animals can engage in is a “freeze” response. With the current methodologies of this study, such animals are classified in the “stand” category, as it was not possible to distinguish between a standing versus a freezing animal. If the assessor wanted to determine whether an animal was standing versus freezing, then the digital methodology would need to be further refined. For example, taking digital images in rapid succession for a defined period of time would help to determine if it is possible to categorize a pig standing and relaxed versus standing and freezing. However, within the context of this experiment, 97.5% of pigs classified as Not Oriented were engaged in behaviors and postures not fearful of the human.
For all behavioral categories, the pig snout was closer to the human observer than was the respective tail base. Snout and tail bases were closer to the observer in the following order: Touch > Oriented > Not Oriented. This might seem like an intuitive result, that pigs faced the human. However, if pigs were fearful, they could be facing away from the observer, resulting in the tail base being the closest anatomical location across behavioral categories. Pigs use their snouts extensively to search for food, detect potential predators, and mark territory. This extensive snout use may help to explain why 45% of pigs classified as Not Oriented had more unobservable snout anatomical locations than did pigs classified as Touch and Oriented. Pigs classified as Not Oriented were engaging in different behaviors (eg, head in feeder) resulting in the observation that their snouts were obstructed. These findings are in agreement with previous “touch, oriented, and not oriented” data for pigs housed in smaller nursery pens.23
On-farm animal-human interaction tests are described and implemented in a variety of ways.24,25 Many use a live observation with a human in the pen, but comparing and contrasting a digital image to a live observer and determining its accuracy has not been previously reported.
In this study, by taking a digital image, snout and tail proximity were additional measures that could be collected. Prior to data collection, the authors considered future questions for creating a calculation sheet that could assign tail distance from the human to “willing to approach on own merit” versus “non-intentional contact with human,” ie, being pushed or knocked by another pig at the time of the assessment. However, if an on-farm welfare assessment program were to include an animal-human interaction test with precise proximity measures, this study showed that there were fewer unobserved tail-base data values, and tail-base measurements would be favored over snout measurements. It should be cautioned that both snout and tail-base measurements were not accurate, with 1066 snouts and 639 tail bases unobservable among the 1793 possible observations. In contrast, all pigs in a pen could be allocated to a Touch, Oriented, or Not Oriented category. Finally, to measure all snout and tail-base anatomical locations with approximately 22 pigs per pen took approximately 10 minutes per pen. Therefore, until a computer program is designed that could automatically recognize and measure anatomical locations on the pig to further calculate the proximity between the animal and human, the proximity measure between animal and human is not a practical recommendation.
Mazurek et al26 hypothesized that the flightiest animal or the dominant animal of a group could have an influence on the reaction of the other animals in the group. In dairy goats, Mazurek et al27 showed that the animals most reactive to humans were the most dominant individuals. Therefore, an avoidance-distance test may be influenced by the response of these animals. If that is the case, it could be concluded that the quality of the human-animal relationship is poor if the animal leader is fearful. The avoidance-distance test is one behavioral test that is applicable for producers, and it has been used to reliably quantify the quality of the human-animal relationship by measuring the size of the animals’ front flight zone. The creation of new areas within a home pen are dictated by the objectives of the test; for example, in some instances, creating areas around the feeder or drinker may be useful if the goal is to determine maintenance or aggressive behaviors around a key resource. In this study, regardless of the pen divisions, the majority of pigs were located in the farthest section from the human observer. However, using only animal location from the human in an animal-human interaction test is rather meaningless unless specific behaviors and postures are also captured to explain the motivational state of the animals.
Finally, a concern with the pig-location method used in this study was that the camera was at a 30-degree angle. This created a length distortion that was magnified the farther the pigs were located within the pen. The standard setting used in the snout and tail-base proximity was determined using the 9.9 ratio of the feeder length and pixel length in the digital image. The feeder was the standard, as it was located in the middle of the pen at the midpoint of camera-angle distortion. To account for distortion, additional measures should be taken (eg, back pen and side gates in cm and digitally in pixels) and compared to obtain the most accurate pixel-to-cm ratio. This effect would likely be magnified if the pen were divided into smaller areas, eg, increments of 30 cm. In this study, home pens were divided into larger spatial locations (thirds and quarters) and the angle of the camera was held constant across all images. Therefore, it could be argued that any possible distortion factor was low and consistent across all digital images. However, camera angle and distortion effects should be considered in the future when improving this methodology.
Forkman et al7 have suggested that the first animal response to a novel or unfamiliar object is more accurate when repeatability of an animal-human interaction is being evaluated. Livestock are prey species with different sensory perceptions than humans, and thus they may react differently to novel or unfamiliar stimuli.4 Reactions may differ with age,28 group size,29 location of the human observer within the pen,30 individual pig differences, and previous caretaker-pig interactions.31 In addition, not all reactions are negative. Recently, three studies attempted to validate the animal-human interaction test. Lensink et al32 measured calves’ responses to humans. The authors concluded that the scores obtained in the approach-and-touch phase were strongly related to the calves’ response to a person in a novel arena, and this approach test could be considered repeatable and reliable. Graml et al22 validated three tests for non-caged hens. All tests measured the reactions of hens towards a stationary person, a moving person approaching the hens, and a stationary person trying to touch individual hens. The authors concluded that the tests all effectively measured the human-hen relationship and that the hens’ reactions to humans could be actively influenced by the quality of the human contact in non-caged systems. Scott et al33 wanted to determine which human-animal test was most reliable and practical enough to be included in an on-farm welfare assessment scheme for sows. The authors concluded that either the animals approaching the human hand or animals approaching the human in their home pen was the most practical and reliable.
In this study, the “approach or touch hand” method was used, similar to that described by Scott et al.32 Furthermore, three behavioral classifications, Touch, Oriented, and Not Oriented, were favored over previous “willingness-to-approach” terminologies used by Fangman et al.6 Although the willingness-to-approach terminology reports a more positive animal-human relationship, the term “willing” is an affective state and in turn may be criticized. In this study, more pigs were classified as Oriented and fewer as Not Oriented using digital-image evaluation. An explanation for this difference between methods may be due to the combination of time for the observer to turn and look at the digital camera, with her head movement and slight change in the angle of the outstretched hand that might in turn have affected the approach or interest of the pigs in the pen. In order to simplify this method and make it more practical on-farm, the current three behavioral categories may be combined into two, “approach” (the summation of “Touch” and “Oriented”) and “Not Oriented,” while making sure the live and digital methods are performed simultaneously rather than consecutively. This should be considered in further refinement of this animal-human interaction test.
When ranking these measures as meaningful to reveal how pigs are coping on-farm, proximity to the human or location within the pen are meaningless for concluding whether a pig is fearful or not. The animal-human interaction measurement system most meaningful to on-farm welfare is assessment of Touch, Oriented, and Not Oriented behavior, combined with further describing the behaviors and postures of Not-Oriented pigs. This information provides a better assessment of pigs not approaching because of fear, or not approaching because they are engaged in other, non-fear-related behaviors.
Implications
• The digital image allows for more animal-human interaction measures to be collected (ie, behaviors and postures, proximity, and location) but is more time-consuming than human-observation methodology.
• Postures and behaviors of pigs classified as Not Oriented should be further described to avoid concluding that pigs not classified in the Touch or Oriented categories are fearful or experiencing a compromised state of welfare.
Acknowledgements
This work was supported by Boehringer Ingelheim Vetmedica, Inc. The authors thank the technician who provided animal care and husbandry.
Conflict of interest
Dr Fangman was employed by Boehringer Ingelheim Vetmedica, Inc during this study.
References
1. Gray JA. The physiology of fear and emotions. In: The Psychology of Fear and Stress. 2nd ed. Cambridge, United Kingdom: Cambridge University Press; 1987:52–74.
2. Moberg GP, Mench JA. Biological responses to stress. In: The Biology of Animal Stress: Basic Principles and Implications for Farm Animal Welfare. Wallingford, England: CAB International; 2000:1–22.
3. Mormède P, Dantzer R, Bluthe RM, Caritez JC. Differences in adaptive abilities of three breeds of Chinese pigs. Behavioral and neuroendocrine studies. Genet Select Evol. 1984;16:85–102.
4. Hemsworth PH, Price EO, Borgwardt R. Behavioral responses of domestic pigs and cattle to humans and novel stimuli. Appl Anim Behav Sci. 1996;50:43–56.
5. Rushen J, Taylor AA, de Passillé AM. Domestic animals’ fear of humans and its effect on their welfare. Appl Anim Behav Sci. 1999;65:285–303.
6. Fangman TJ, Johnson AK, Okones J, Edler RA. Willingness-to-approach behavior of weaned pigs following injection with Mycoplasma hyopneumoniae vaccines. J Swine Health Prod. 2011;19:19–25.
7. Forkman B, Boissy A, Meunier-Salaün MC, Canali E, Jones RB. A critical review of fear tests used on cattle, pigs, sheep, poultry and horses. Phys Behav. 2007;92:340–374.
8. Moore AS, Gonyou HW, Stookey JM, McLaren DG. Effect of group composition and pen size on behavior, productivity and immune response of growing pigs. Appl Anim Behav Sci. 1994;40:13–30.
9. Miura A, Tanida H, Tanaka T, Yoshimoto T. The influence of human posture and movement on the approach and escape behaviour of weanling pigs. Appl Anim Behav Sci. 1996;49:247–256.
10. de Passillé AM, Rushen J. Can we measure human-animal interactions in on-farm animal welfare assessment? Some unresolved issues. Appl Anim Behav Sci. 2005;92:193–209.
11. European Commission. 2009. Welfare Quality Assessment Protocol for Pigs. Available at: http://edepot.wur.nl/233470. Accessed 28 February 2014.
12. Hemsworth PH, Barnett JL. The effects of early contact with humans on the subsequent level of fear of humans in pigs. Appl Anim Behav Sci. 1992;35:83–90.
13. Andersen IL, Berg S, Bøe KE, Edwards SA. Positive handling in late pregnancy and the consequences for maternal behaviour and production in sows. Appl Anim Behav Sci. 2006;99:64–76.
14. Hemsworth PH, Barnett JL, Coleman GJ, Hansen C. A study of the relationship between the attitudinal and behavioural profiles of stockpersons and the level of fear of human and reproductive performance of commercial pigs. Appl Anim Behav Sci. 1989;23:301–314.
15. Murphey RM, Moura-Duarte FA, Torres-Penedo MC. Responses of cattle to humans in open spaces: breed comparisons and approach-avoidance relationships. Behav Genet. 1981;11:37–48.
16. Lensink BJ, Boivin X, Pradel P, Le Nindre P, Veissier I. Reducing veal calves’ reactivity to people by providing additional human contact. J Anim Sci. 2000;78:1213–1218.
*17. Marchant J, Burfoot A, Corning S, Broom DM. The “human-approach test” – a test of fearfulness of investigatory behaviour? In: Hemsworth PH, Spinka M, Costal L, eds. Proc Internat Soc Appl Ethology. Prague, Czechoslovakia. 1997;182.
18. National Pork Board. Swine Care Handbook. 2003. Available at: www.pork.org. Accessed 22 February 2014.
19. National Pork Board. Pork Quality Assurance Plus. 2007. Available at: www.pork.org. Accessed 22 February 2014.
20. National Research Council. Nutrient Requirements of Swine. 10th ed. Washington, DC: National Academy Press; 1998.
21. Hurnik JF, Webster AB, Siegel, PB. Dictionary of Farm Animal Behavior. 2nd ed. Ames, Iowa: Iowa State University Press; 1995.
22. Graml C, Waiblinger S, Niebuhr K. Validation of tests for on-farm assessment of the hen-human relationship in non-caged systems. Appl Anim Behav Sci. 2008;111:301–310.
23. Weimer S, Johnson A, Karriker L, Stalder S, Tyler H. Animal-human interaction comparing live human observation and digital image evaluation methodologies [master’s thesis]. Ames, Iowa: Iowa State University, Iowa; 2012.
24. Edwards SA. Experimental welfare assessment and on-farm application. Anim Welf. 2007;16:111–115.
25. Hemsworth PH, Barnett JL, Coleman GJ. The integration of human-animal relations into animal welfare monitoring schemes. Anim Welf. 2009;18:335–345.
26. Mazurek M, McGee M, Minchin W, Crowe M, Earley B. Is the avoidance distance test for the assessment of animals’ responsiveness to humans influenced by either the dominant or flightiest animal in the group? Appl Anim Behav Sci. 2011;132:107–113.
27. Mazurek M, Marie M, Desor D. Potential animal-centred indicators of dairy goat welfare. Anim Welf. 2007;16:161–164.
28. Hemsworth PH, Barnett JL. The effects of aversively handling pigs either individually or in groups, on their behaviour, growth and corticosteroids. Appl Anim Behav Sci. 1991;30:61–72.
29. Samarakone TS, Gonyou HW. Domestic pigs alter their social strategy in response to social group size. Appl Anim Behav Sci. 2009;121:8–15.
30. Windschruner I, Boivin X, Waiblinger S. Reliability of an avoidance distance test for the assessment of animals’ responsiveness to humans and a preliminary investigation of its association with farmers’ attitudes on bull fattening farms. Appl Anim Behav Sci. 2009;117:111–127.
31. Spoolder HAM, Burbidge JA, Lawrence AB, Simmins PH, Edwards SA. Individual behavioral differences in pigs: intra- and inter-test consistency. Appl Anim Behav Sci. 1996;49:185–198.
32. Lensink BJ, van Reenen CG, Engel B, Rodenburg TB, Veissier I. Repeatability and reliability of an approach test to determine calves’ responsiveness to humans: “a brief report.” Appl Anim Behav Sci. 2003;83:325–330.
33. Scott K, Laws DM, Courboulay V, Meunier-Salaün MC, Edwards S. Comparison of methods to assess fear of humans in sows. Appl Anim Behav Sci. 2009;118:36–41.
*Non-refereed reference.